🌍 Public
Test Chloropleth
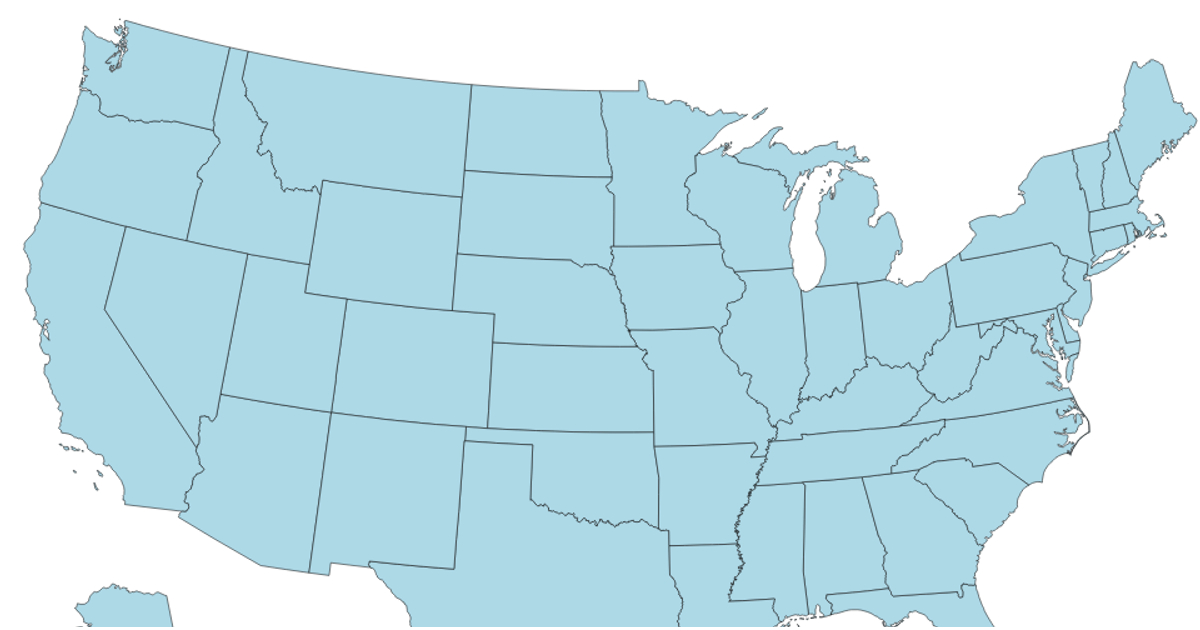
This visualization displays the number of data points across U.S. states in a hexagon tile grid choropleth. The color scale uses a threshold encoding with d3.scaleThreshold and d3.schemeBlues to represent counts from the StateFile.csv dataset. The map is rendered using d3.geoPath and TopoJSON, loading US state hexgrid geometry from a GitHub-hosted GeoJSON file. A legend with an axis provides reference for interpreting the color values.
AI-generated descriptionA bare minimum HTML page demonstrating use of CSS and JavaScript.
See also React Starter.
MIT Licensed





Comments
Sign in to join the discussion.