🌍 Public
Bar Chart: Quantity by StockCode
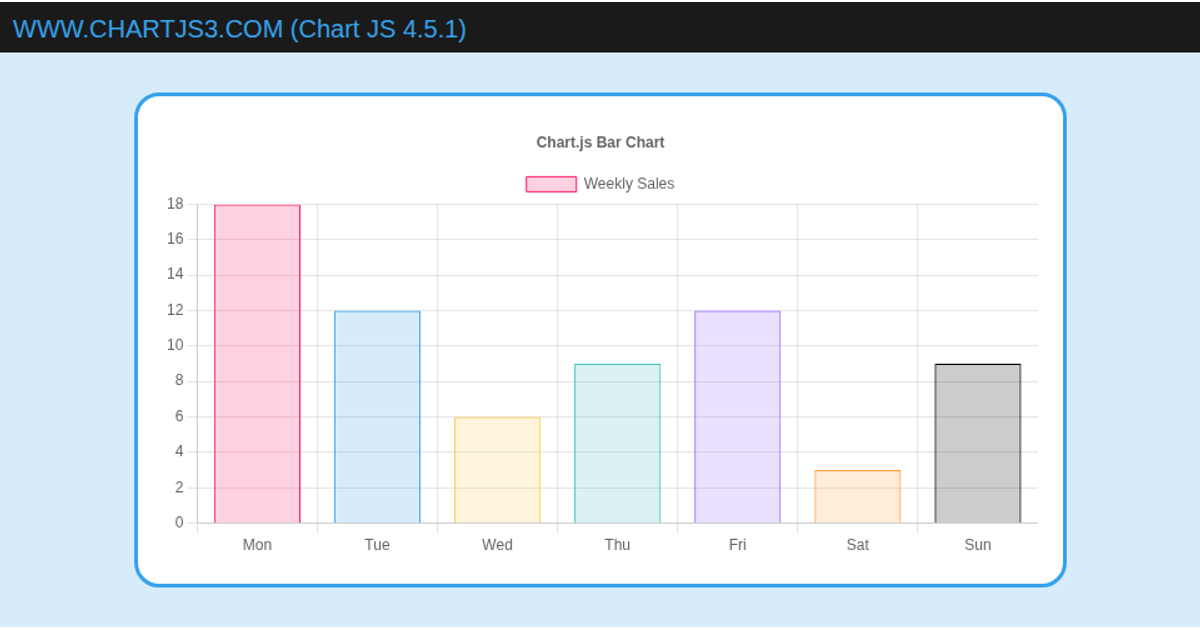
This bar chart displays road accident frequency by day of the week, with labels for each day and corresponding accident counts. It uses the Chart.js library to render a bar chart on an HTML canvas element, with annotations highlighting specific values: a red line at 4 for Monday, an orange line at 3 for Friday, and a green line at 1 for the weekend. The chart includes axis titles and a main title, with data hardcoded in the script.
AI-generated descriptionA bare minimum HTML page demonstrating use of CSS and JavaScript.
See also React Starter.
MIT Licensed


Comments
Sign in to join the discussion.