🌍 Public
Fork of Activity 5
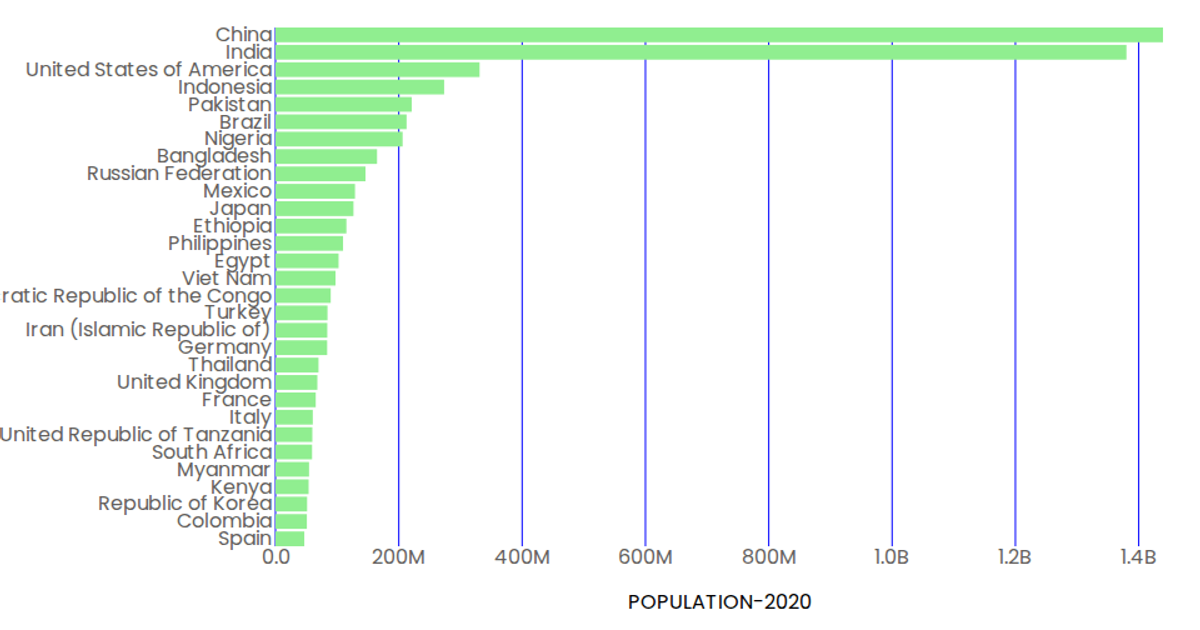
This example shows a horizontal bar chart of population estimates for 30 countries in 2020, using a CSV dataset loaded from GitHub. The chart displays rectangular bars colored light green, with blue tick lines and labels for each country on the left axis. Built with React and D3 v5, it uses `scaleBand` for the categorical y-axis, `scaleLinear` for the continuous x-axis, and `format` to abbreviate population values (e.g., converting millions to billions). The `Marks`, `AxisBottom`, and `AxisLeft` components render the SVG elements.
AI-generated descriptionMIT Licensed






Comments
Sign in to join the discussion.