🌍 Public
Experiment
SStefanZhang
Last edited Oct 14, 2020
Created on Oct 14, 2020
Forked from Bike Rental DataViz Humidity vs Temperature
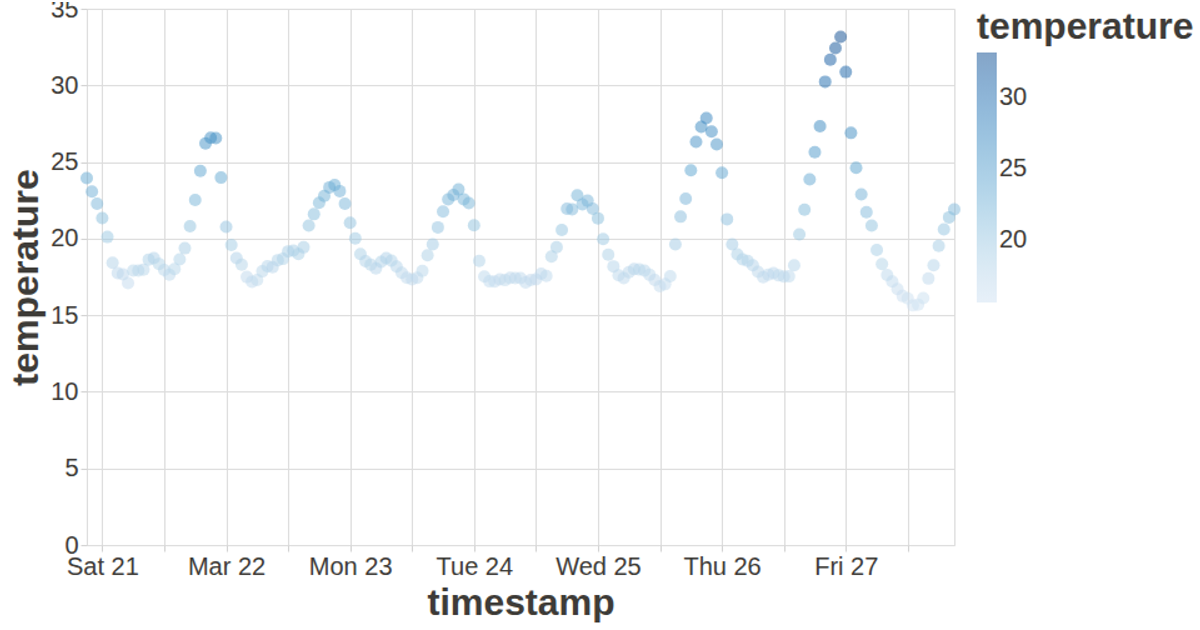
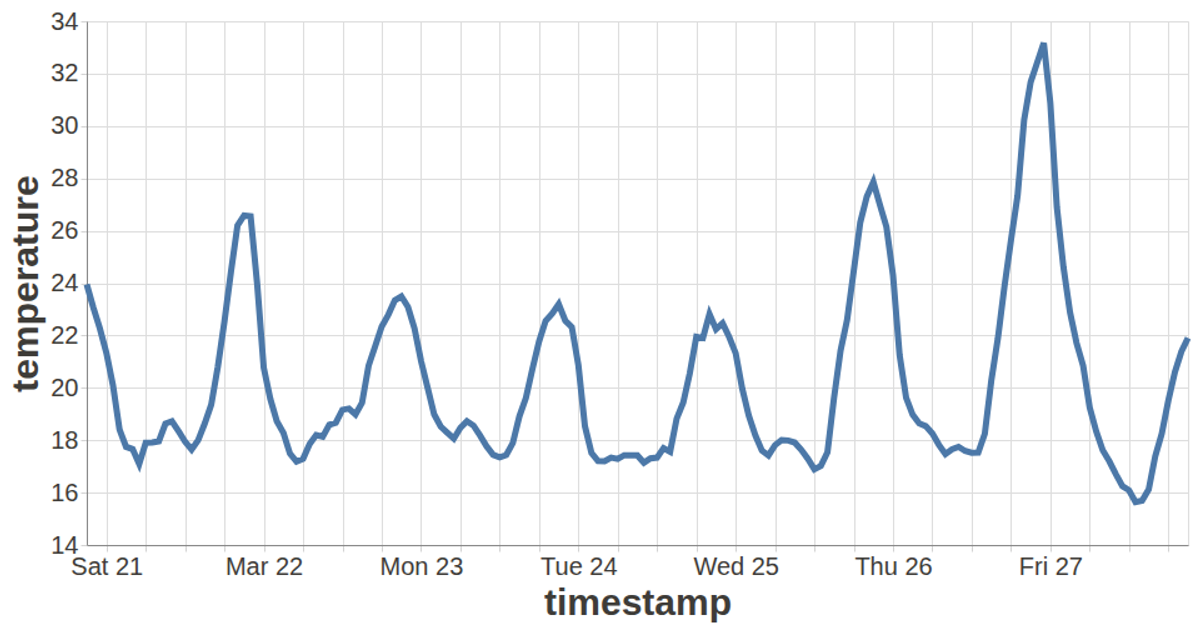
This bar chart visualizes temperature measurements over time, derived from a Twitter sentiment dataset hosted at sentiment.stefanzhang.com. The visualization uses Vega-Lite’s API via `vega-lite-api`, with the chart configured through `vl.markBar()` and encoding time on the x-axis and temperature on the y-axis, both with scales that do not include zero. It fetches data asynchronously using `d3.csv` from the D3 library, then renders the plot to fill the browser window with a custom dark theme and tooltip support from `vega-tooltip`.
AI-generated descriptionExperiment
MIT Licensed





Comments
Sign in to join the discussion.