🌍 Public
Fork of Fork of FZ_ICE8_Q1_WorldMap_Hyndavi
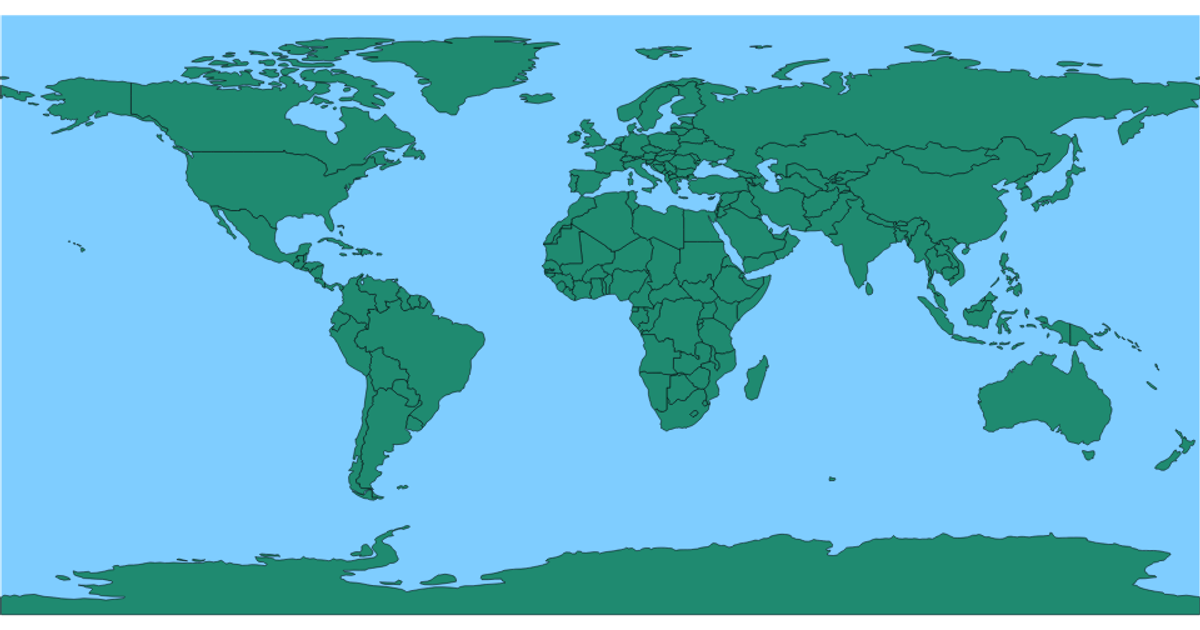
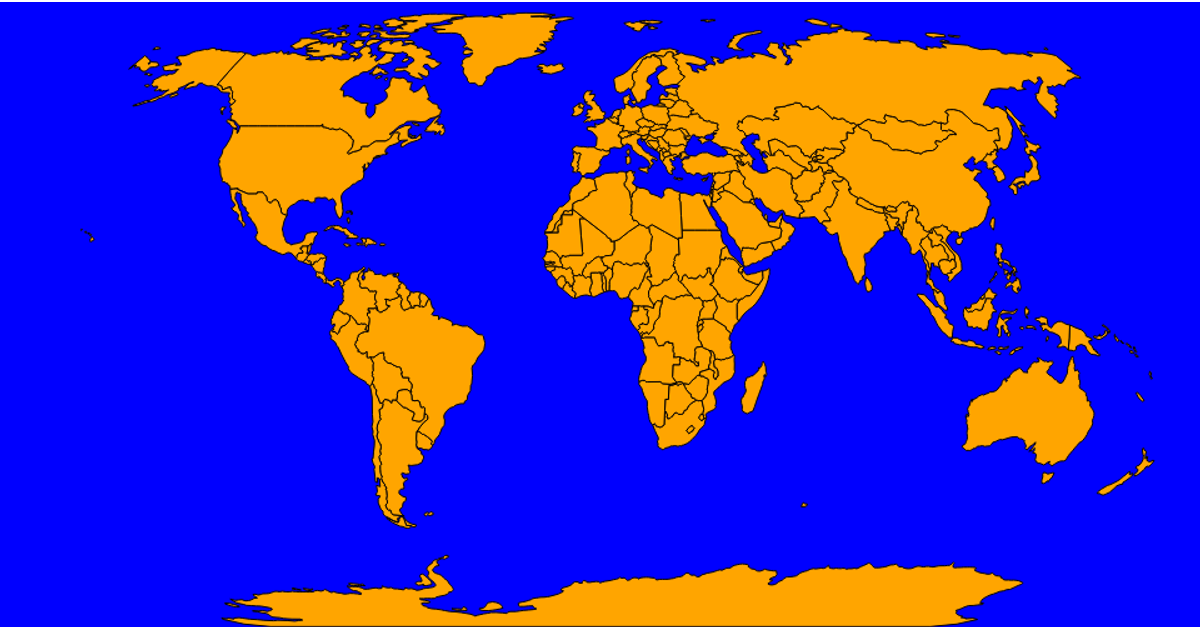
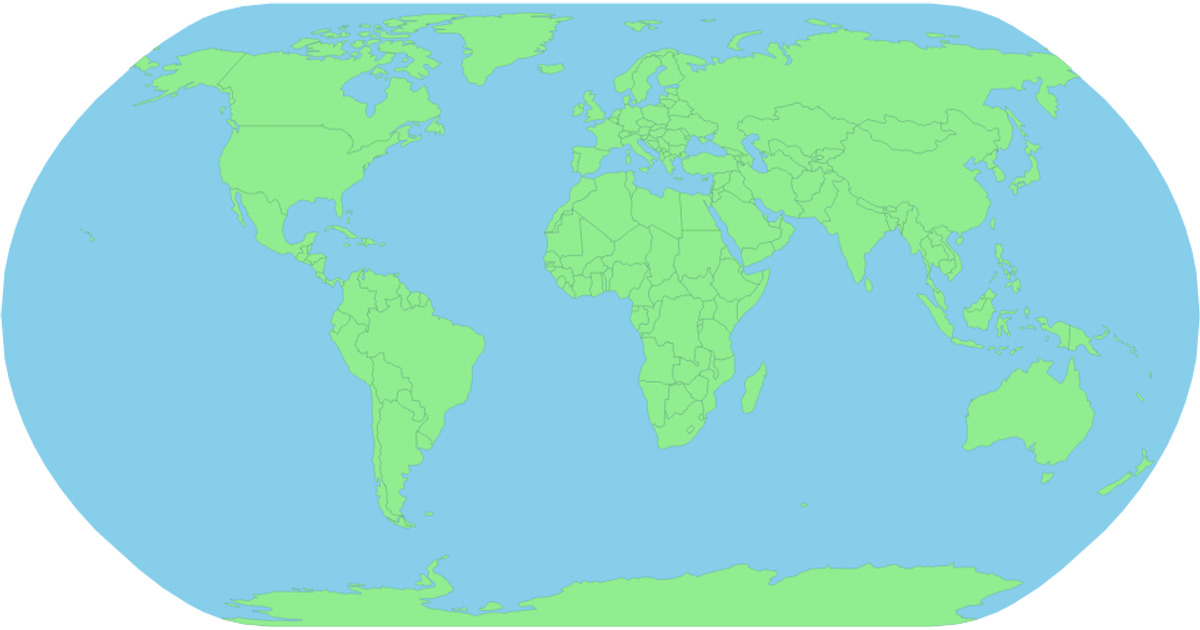
This interactive world map displays country boundaries on a natural Earth projection, with each country shaded in a sequential blue color scale and identified by name via a tooltip on hover. The visualization loads TopoJSON data from the world-atlas package, converts it to GeoJSON features using topojson-client, and renders the map as SVG paths via `d3.geoPath` with a `d3.geoNaturalEarth1` projection. The D3.js v7 code also implements interactive mouse events to show tooltips with country names.
AI-generated descriptionMIT Licensed




Comments
Sign in to join the discussion.