Fork of d3 edge bundling (TAI-POW dataset)
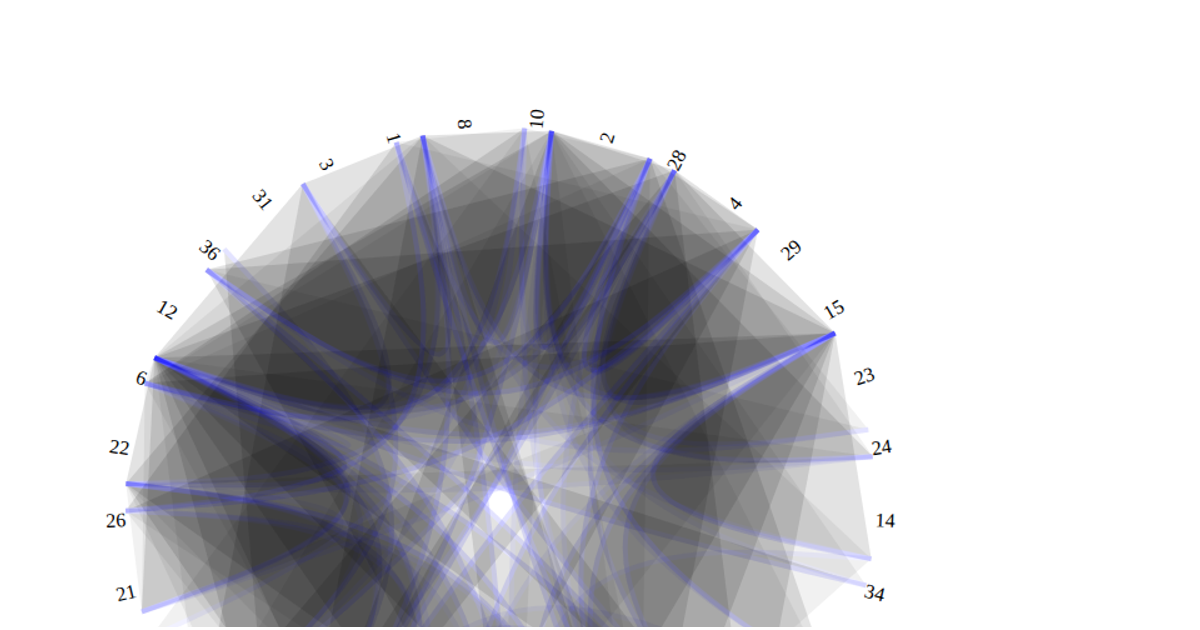
This visualization uses D3.js v4 to display the relationships among 32 Tuskegee Airmen who were prisoners of war during World War II, based on the TAI-POW dataset from networkrepository.com. The chart presents a hierarchical edge bundling layout where each airman appears as a labeled node around a circular ring, with curved paths connecting them to show squadron associations. The `d3.cluster()` and `d3.radialLine()` APIs compute node positions and bundle edges, while `d3.curveBundle.beta()` controls edge tension. An interactive slider adjusts the bundling strength, and a `d3.scaleLinear()` function maps data values to varying bubble sizes.
AI-generated descriptionAn edge bundling chart in D3
BTW: The data was simplified to help with creating this visualization.
Link to original dataset: https://networkrepository.com/soc.php




Comments
Sign in to join the discussion.