🌍 Public
Fork of Sized Points on a Map
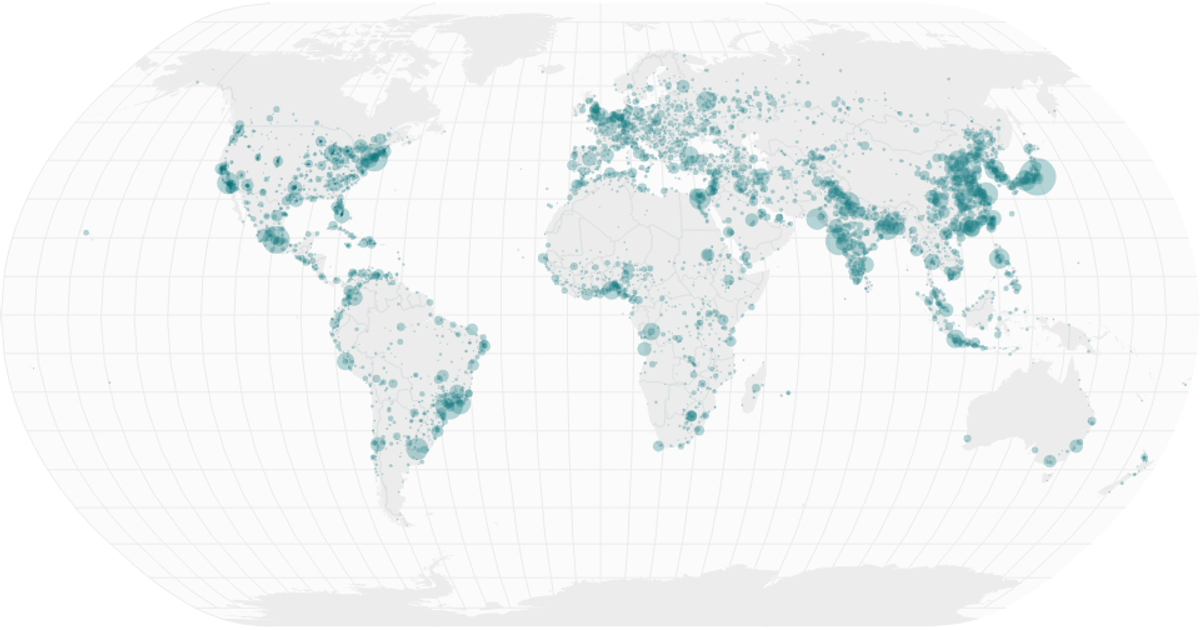
This example renders a world map with circles sized proportionally to city populations, filtering for cities with over 50,000 residents. The visualization uses React to structure the SVG output, with D3 v5’s `geoAlbers` projection and `geoPath` for country boundaries, and a square-root scale for circle radii. Data comes from the Simplemaps World Cities Database, while country shapes use the World Atlas TopoJSON. The map also includes graticules and subtle styling for land and interior borders.
AI-generated descriptionA world map showing cities with population greater than 50,000. City data from Simplemaps: World Cities Database.
Country boundaries from World Atlas TopoJSON, polished for visual style, including graticules.
MIT Licensed




Comments
Sign in to join the discussion.