🌍 Public
Vizhub for pie chart
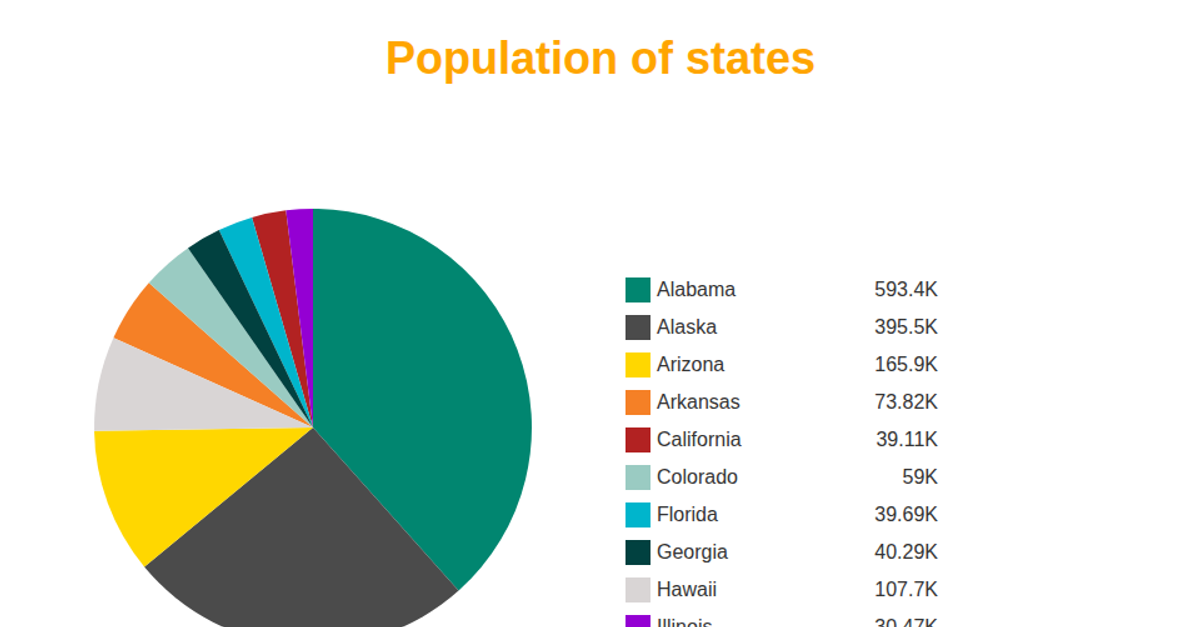
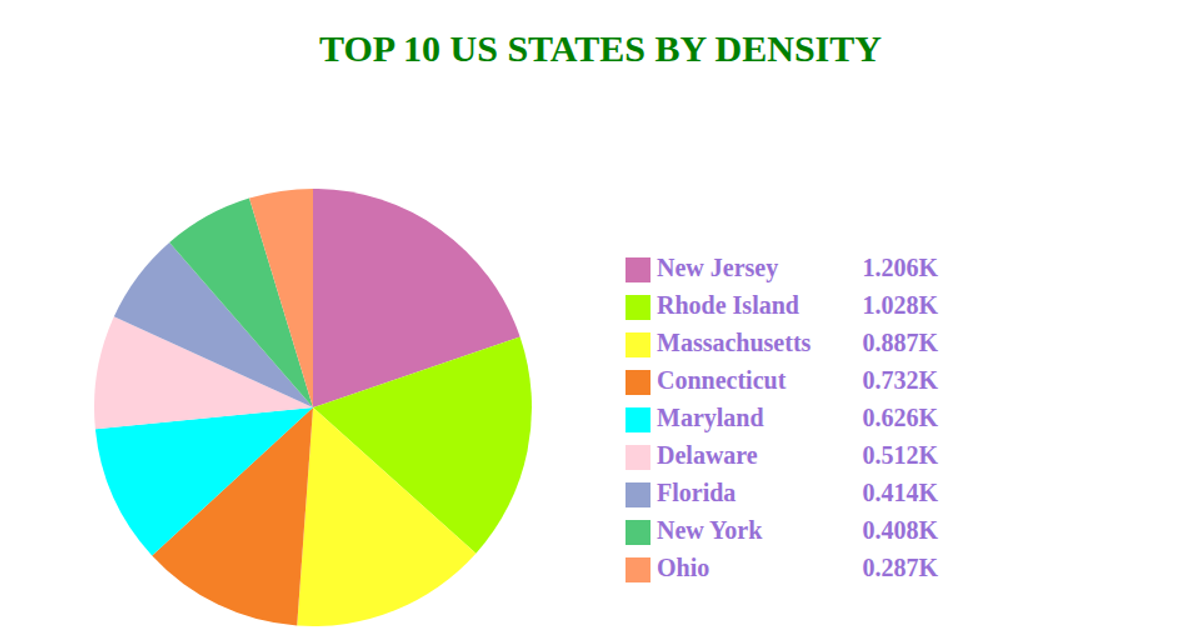
This pie chart visualizes the top five U.S. states by fuel consumption percentage, with each slice labeled and color-coded, alongside a legend listing state names and values. The data is loaded from a CSV file via `d3.csv`, and the chart is rendered as SVG using `d3.pie`, `d3.arc`, and `d3.scaleOrdinal` for colors. Text labels are positioned on slice centroids with `arcGenerator.centroid`, while the legend is built manually with SVG rectangles and text elements. The visualization updates dynamically as the CSV is fetched asynchronously.
AI-generated descriptionMIT Licensed





Comments
Sign in to join the discussion.