🌍 Public
DataVis_HW1
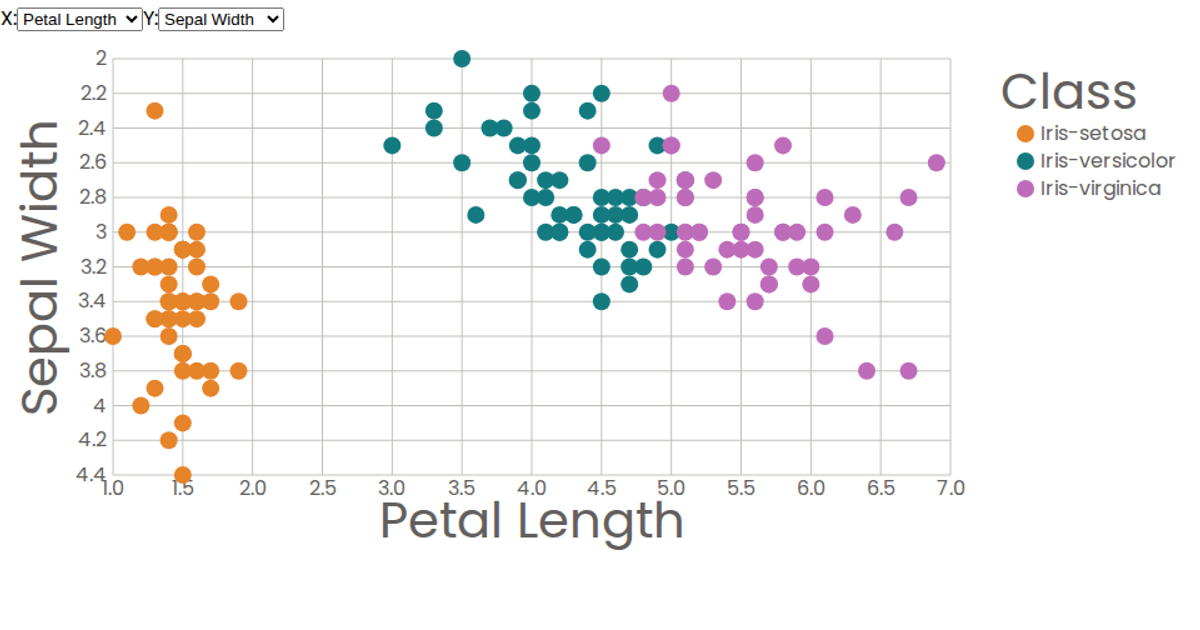
This interactive scatter plot explores the Iris Dataset, allowing users to compare any two numerical attributes or species via dropdown menus for the X and Y axes. The visualization renders data points as circles using React and D3 scales (d3.scaleLinear) for positioning, with axes generated from d3.ticks. The code uses d3.csv for data loading, React hooks (useState, useEffect) for state and data fetching, and SVG for rendering.
AI-generated descriptionA scatter plot of The Iris Dataset.
MIT Licensed






Comments
Sign in to join the discussion.