🌍 Public
ICE -8 Family tree
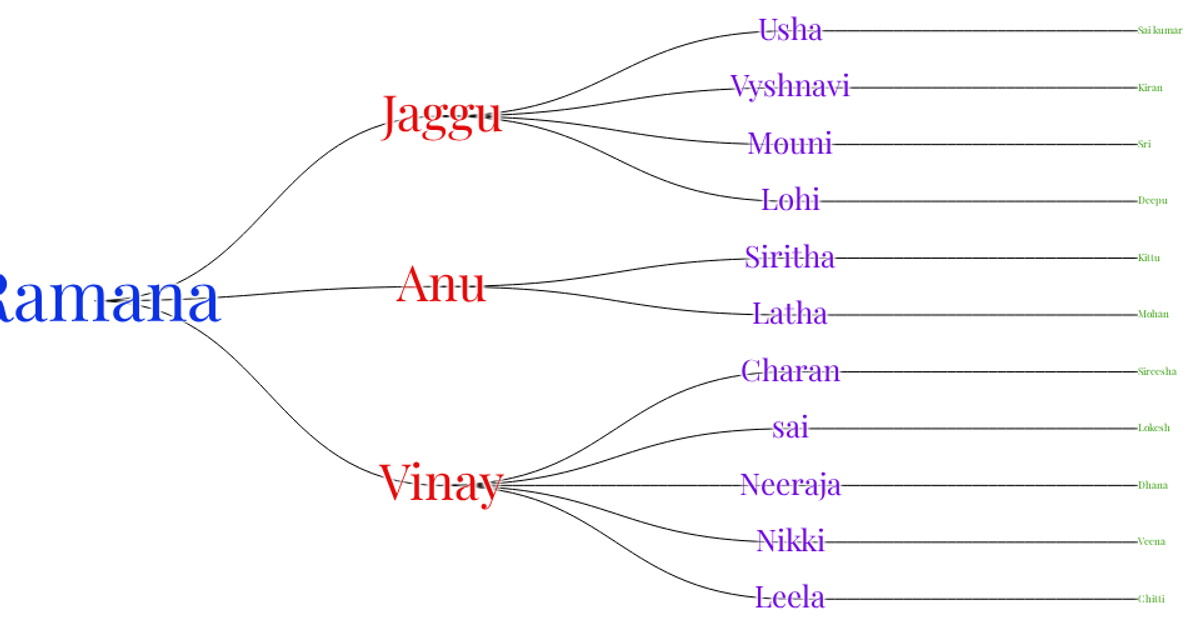
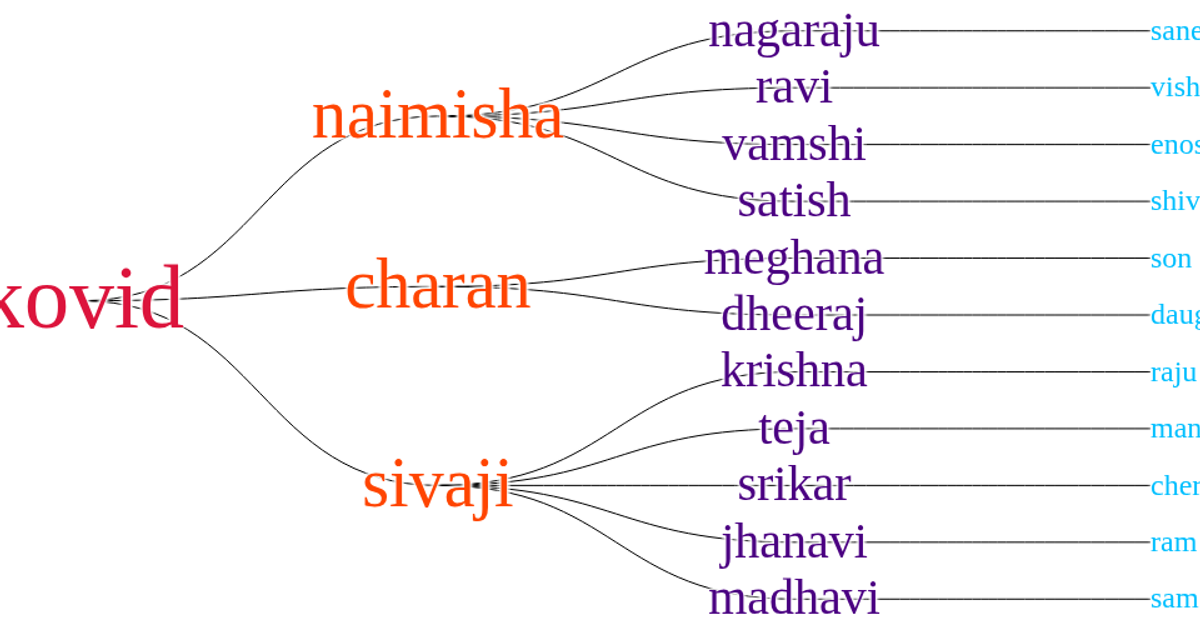
A family tree visualization uses a radial dendrogram to display four generations of a family, with each node positioned by birth year and connected by curved links. Decade rings provide a temporal scale, and node labels are oriented outward or inward depending on their angular position. The visualization is built with D3.js, using `d3.layout.tree` for layout, `d3.svg.diagonal.radial` for the connecting paths, and `d3.json` to load the family data from `data.json`. The underlying SVG is rendered via the `d3.select().append()` API, with styling controlled by an external stylesheet.
AI-generated descriptionMIT Licensed






Comments
Sign in to join the discussion.