🌍 Public
Task_2: ICE 8 - US Country Map
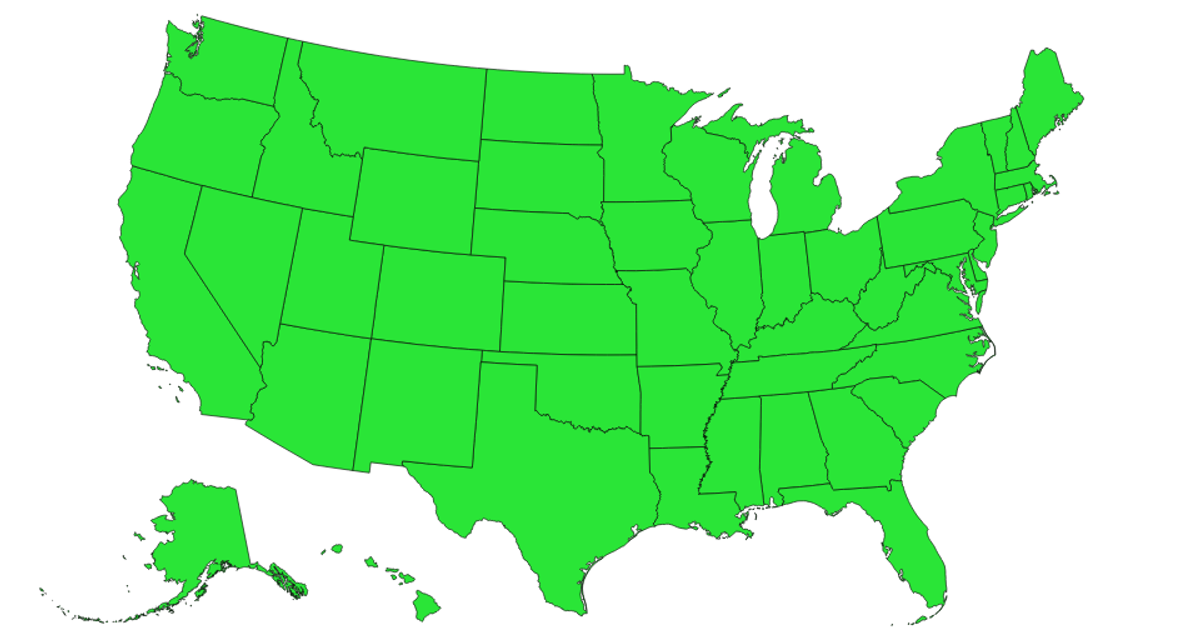
This example shows a map of U.S. states, rendered as orange filled paths with gray outlines against a light blue ocean background. It uses the D3 v4 library with the `d3.geoPath` projection (`d3.geoAlbersUsa`) to draw the state boundaries, and loads TopoJSON data from the `us-atlas` package via `topojson-client`. The states are appended as SVG paths within a single `<svg>` element, with the map centered using explicit translation and scale parameters.
AI-generated descriptionA bare minimum HTML page demonstrating use of CSS and JavaScript.
MIT Licensed




Comments
Sign in to join the discussion.