🌍 Public
mouse follower
Ggayatrisridhar
Last edited May 14, 2021
Created on May 7, 2021
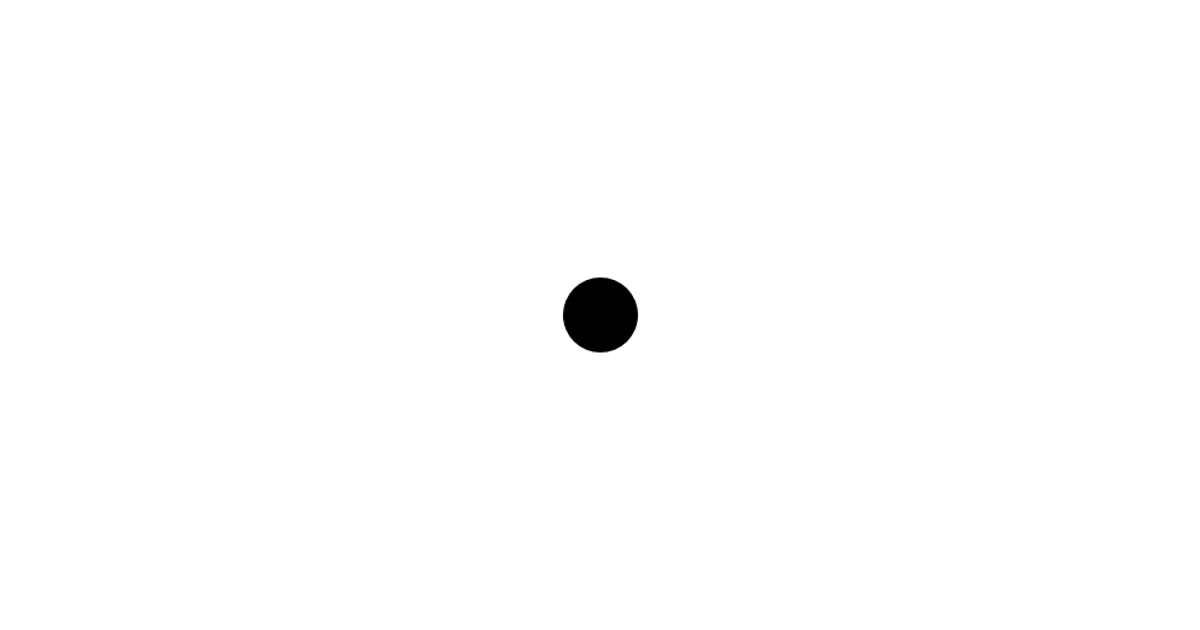
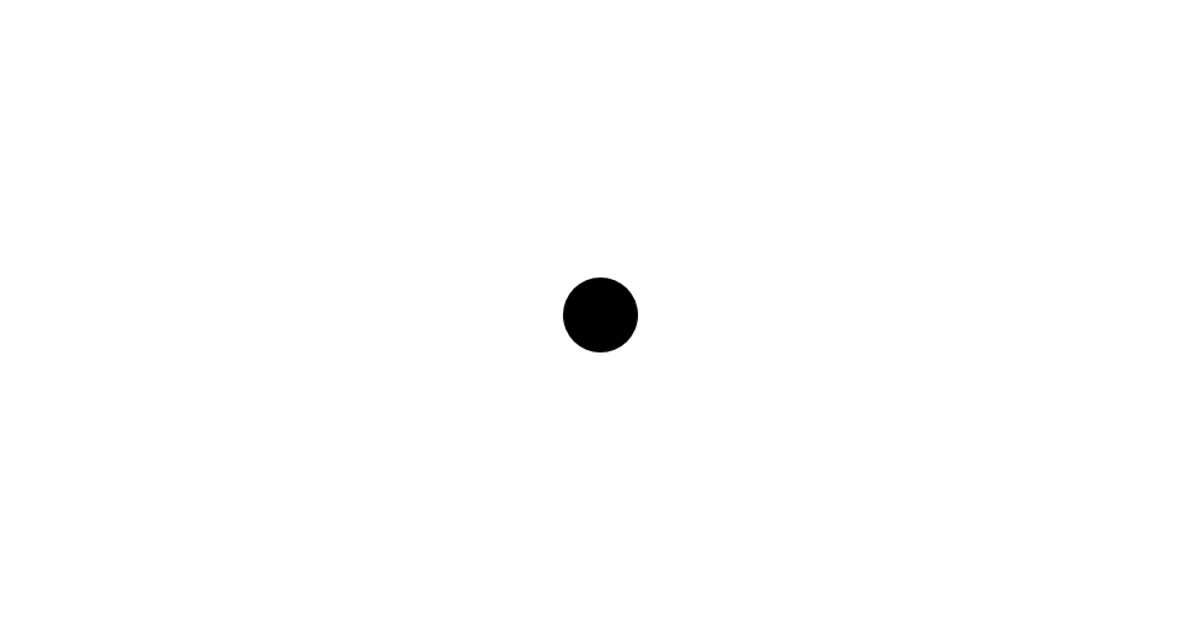
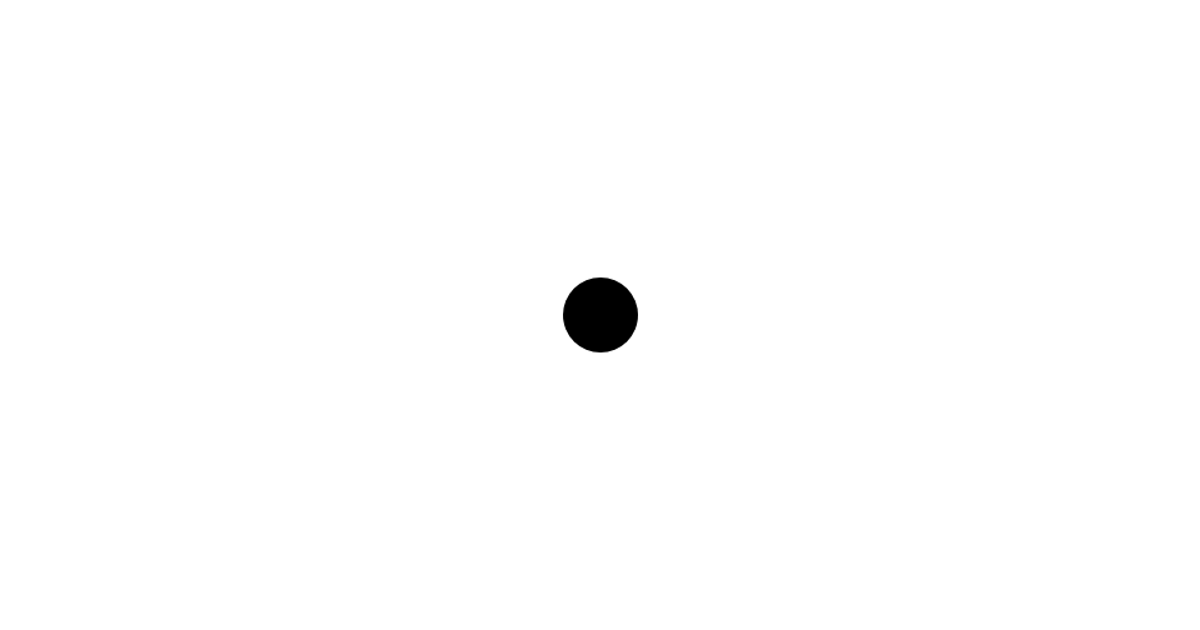
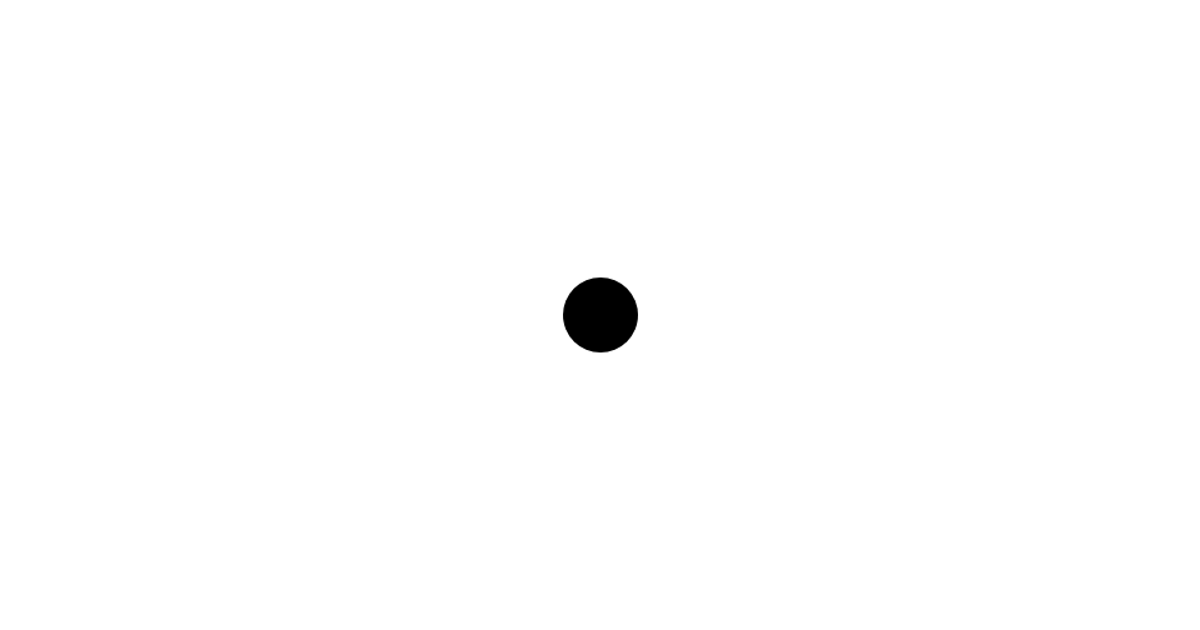
A black dot follows the mouse cursor across an SVG canvas. The application is built with React, using the `useState` hook to store the cursor's `clientX` and `clientY` coordinates and `useCallback` to prevent unnecessary re-renders during mouse movement. The `onMouseMove` event triggers updates to a circle element's `cx` and `cy` properties, with radius fixed at 30 pixels. The chart uses D3's `arc` import and renders via the `ReactDOM.render` method against a background of 960 by 500 pixels.
AI-generated descriptionIt is a mouse following black dot. Some important notes on useState and useCallback.Btw event has 2 properties namely clientX and clientY which gives us the coordinates of x and y.
MIT Licensed



Comments
Sign in to join the discussion.