🌍 Public
Assignment 6
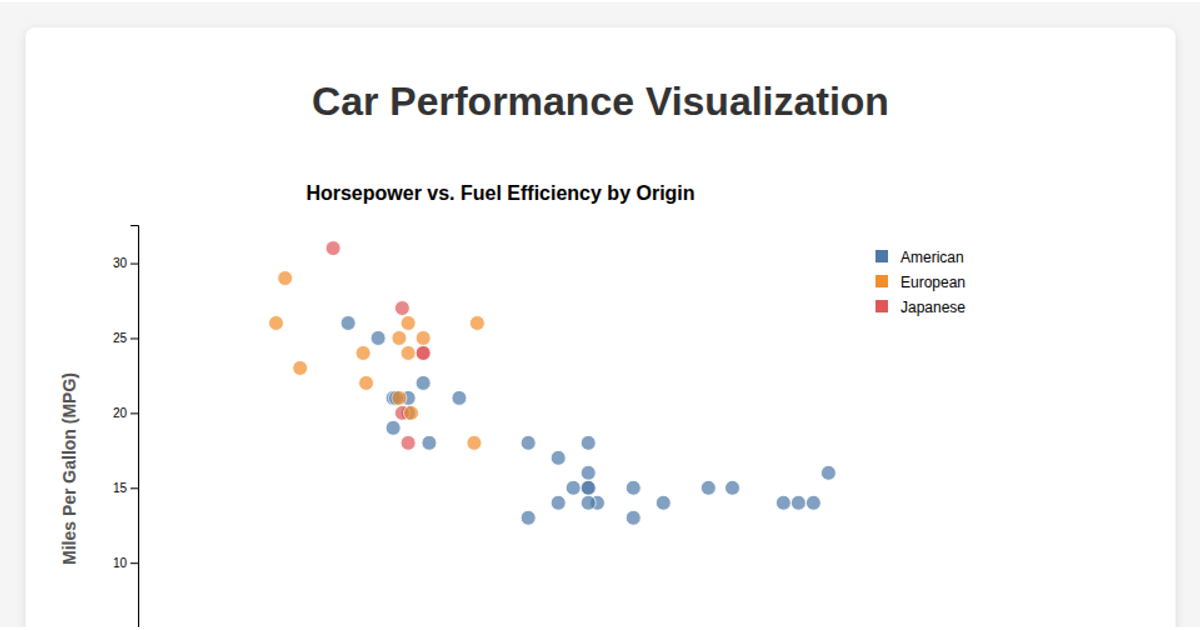
This example by Nhi11 demonstrates a scatter plot of car performance data, plotting Horsepower against Zero-to-Sixty seconds, with points colored by Origin_Region. It explores tooltip delay rules of thumb by introducing a 2-second artificial delay before tooltips appear, making the delayed feedback visible. The visualization uses D3 v7's `d3.csv` to load data, `d3.scaleLinear` for axes, and `d3.schemeTableau10` for categorical colors. Tooltips render as a styled HTML div near the cursor, triggered only after the delay timer expires. The code highlights the trade-off between responsiveness and user intent when implementing hover interactions.
AI-generated descriptionMIT Licensed


Comments
Sign in to join the discussion.