🌍 Public
Fork of task-3
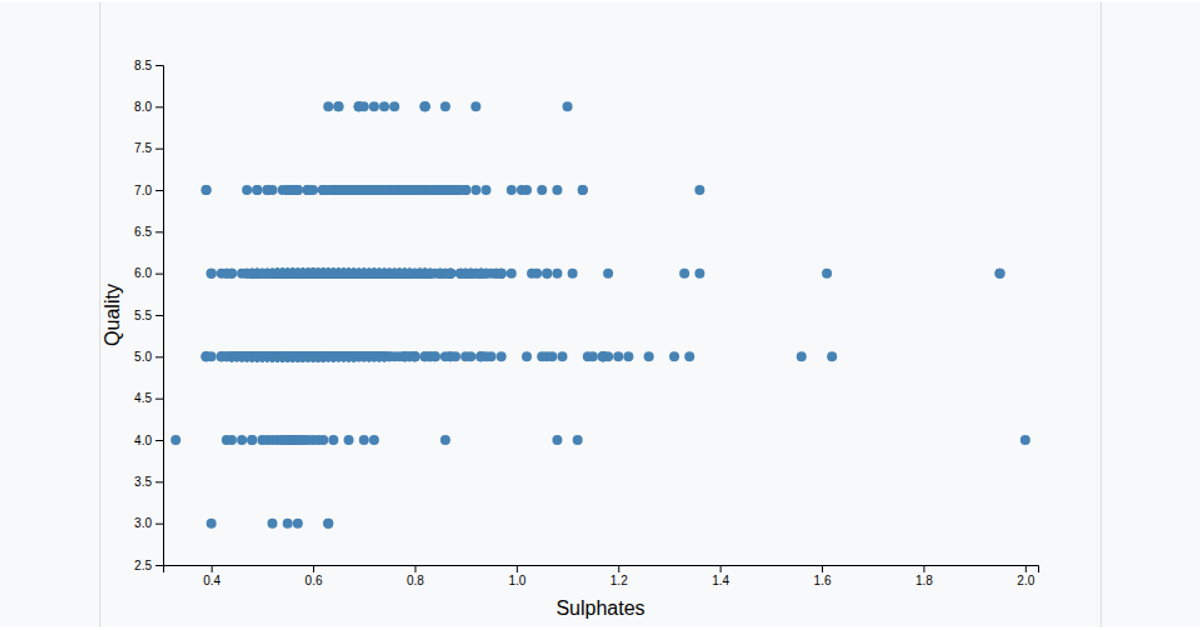
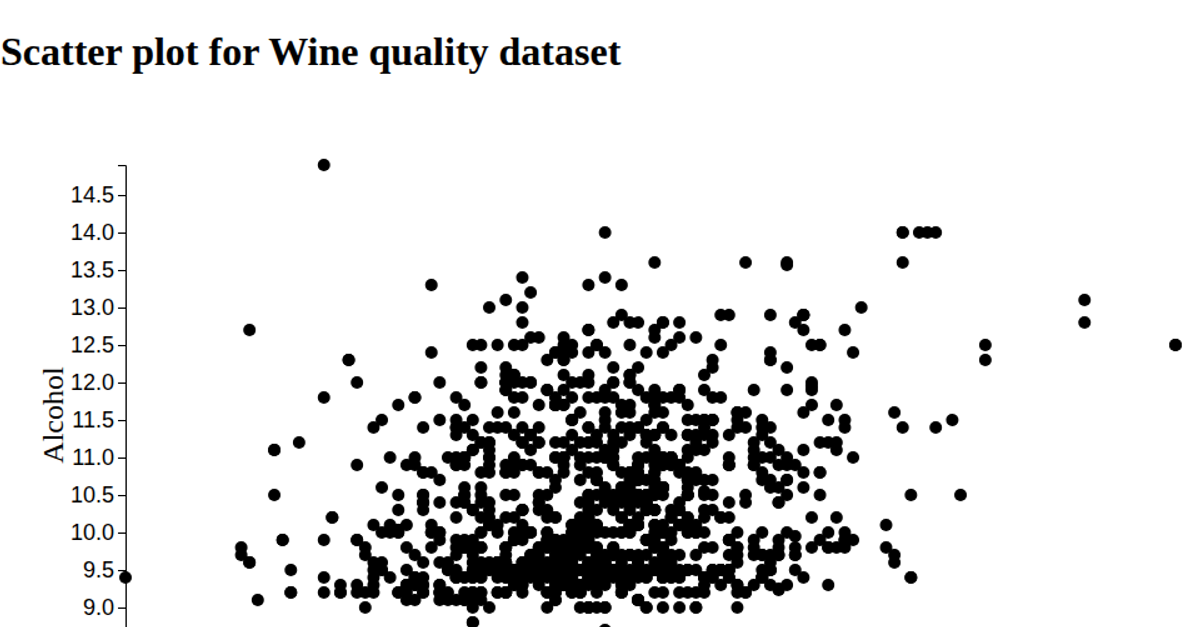
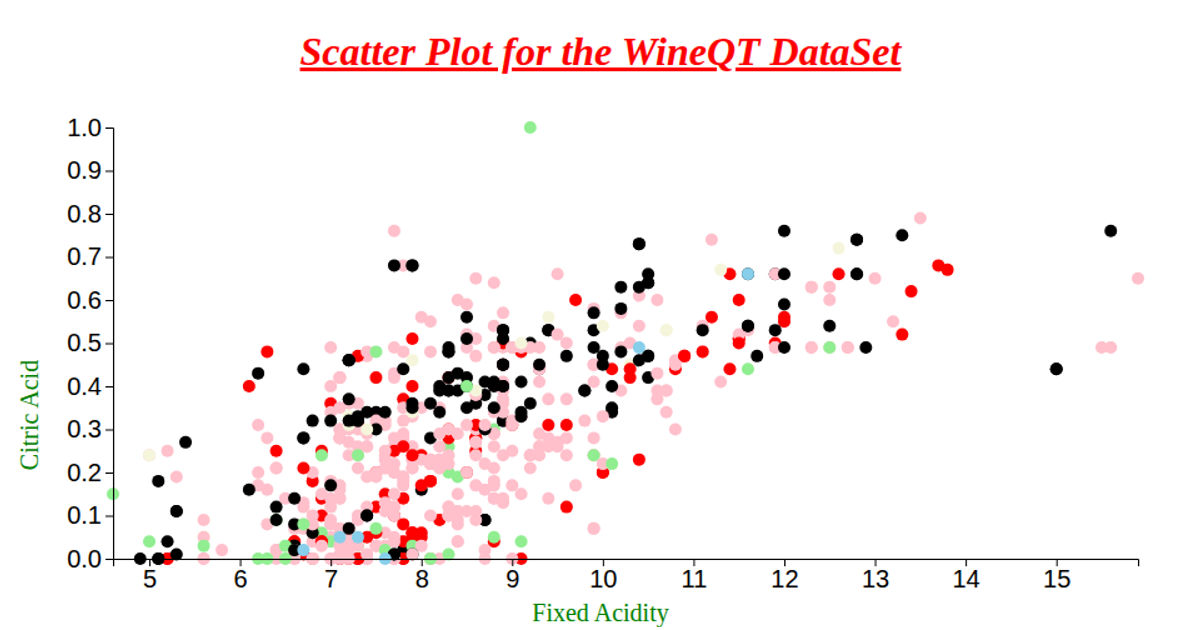
This example shows the relationship between wine review points and price in a scatter plot, with each wine represented as a steelblue circle. The visualization loads wine review data from a local CSV file and plots points on the x-axis against price on the y-axis. The code uses D3 v7 APIs including `d3.csv` for data loading, `d3.scaleLinear` for coordinate mapping, `d3.axisBottom` and `d3.axisLeft` for chart axes, and `d3.select` with `svg.selectAll` to append circles to the SVG renderer.
AI-generated descriptionAn example showing the capabilities of VizHub:
- Loads D3 via UNPKG.
- Demonstrates use of
importfrom"d3". - Demonstrates use of
importfrom local ES6 modules.
MIT Licensed




Comments
Sign in to join the discussion.