🌍 Public
Fork of Vega-Lite API - Line and Area
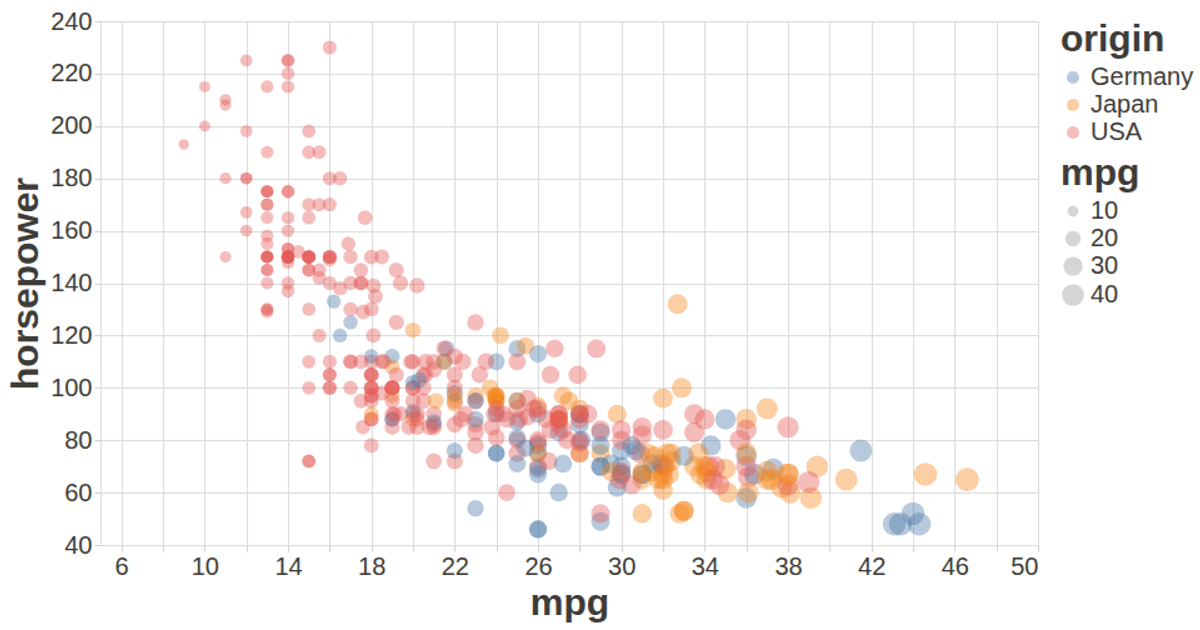
This example uses the Vega-Lite API to create a scatterplot from automobile data, mapping origin, horsepower, weight, and mpg to visual channels. A semi-transparent circle mark with a configurable axis style renders the points, and a tooltip displays the vehicle name. The code registers Vega and Vega-Lite libraries, loads CSV data via d3.csv, and applies a custom configuration for fonts and tick colors. The visualization adapts to the window size with a fit autosize setting.
AI-generated descriptionA template for using Vega-Lite API.
MIT Licensed




Comments
Sign in to join the discussion.