🌍 Public
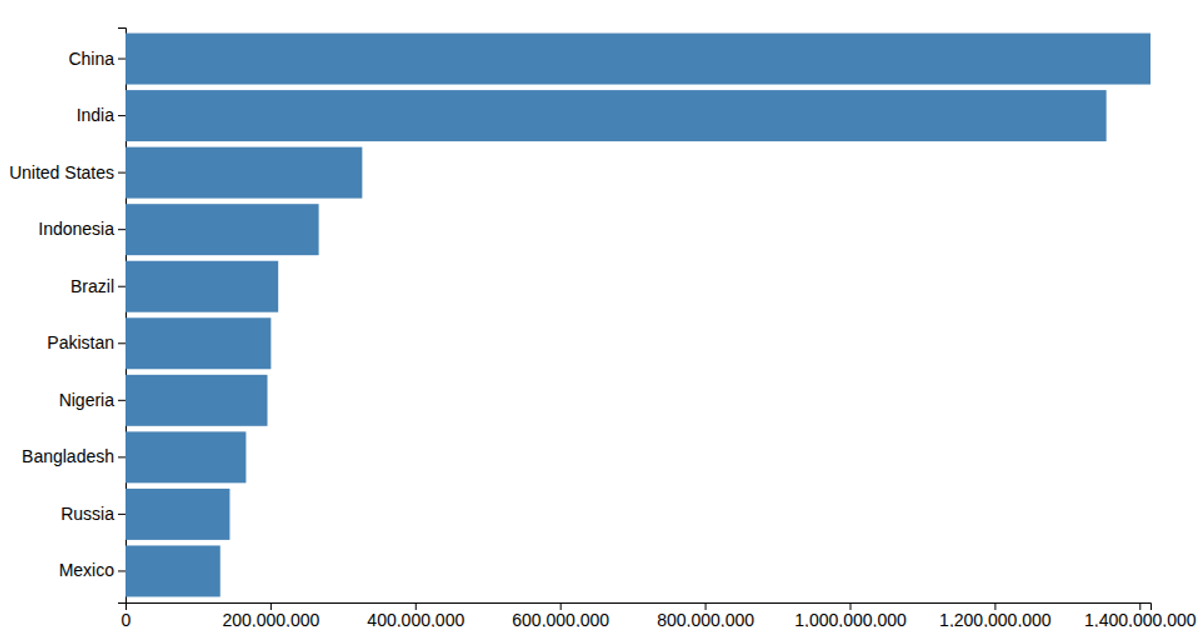
Lets make a bar chart
This bar chart displays population figures for the ten most populous countries, using horizontal bars sorted by country name along the y-axis. The visualization loads data from a CSV file, multiplies each population value by 1000, and renders SVG rectangles using d3.scaleLinear for the x-axis and d3.scaleBand for the categorical y-axis. It relies on d3.csv, d3.max, d3.axisLeft, and d3.axisBottom to generate the chart within an SVG canvas.
AI-generated descriptionMIT Licensed



Comments
Sign in to join the discussion.