🌍 Public
Fouzan Uddin's TikTok Dataset
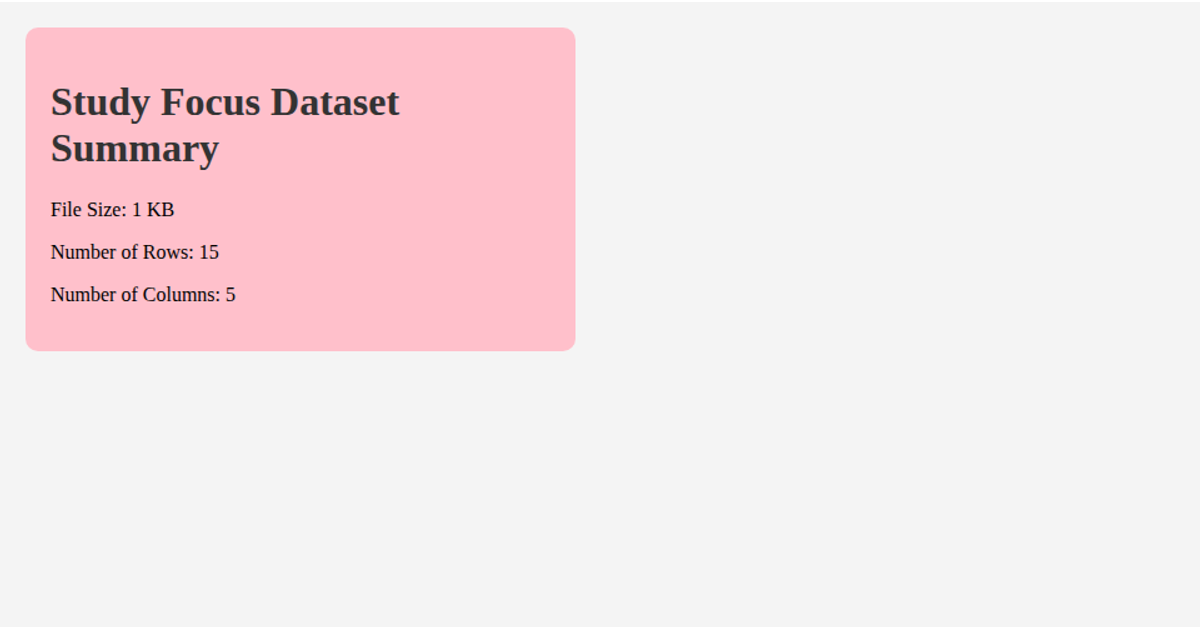
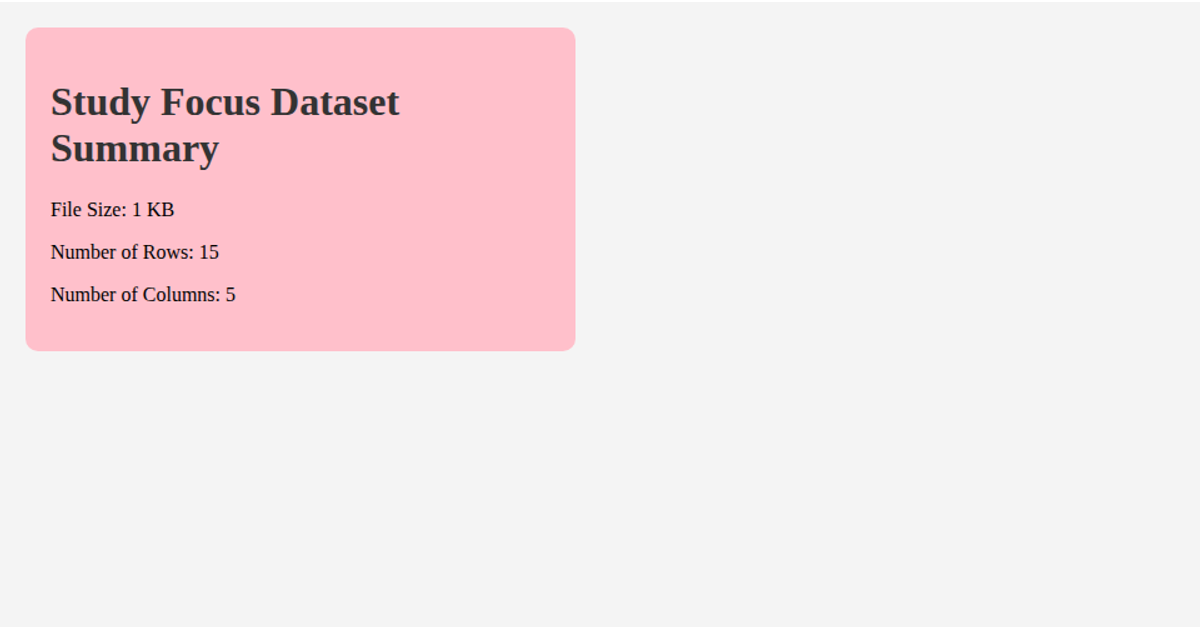
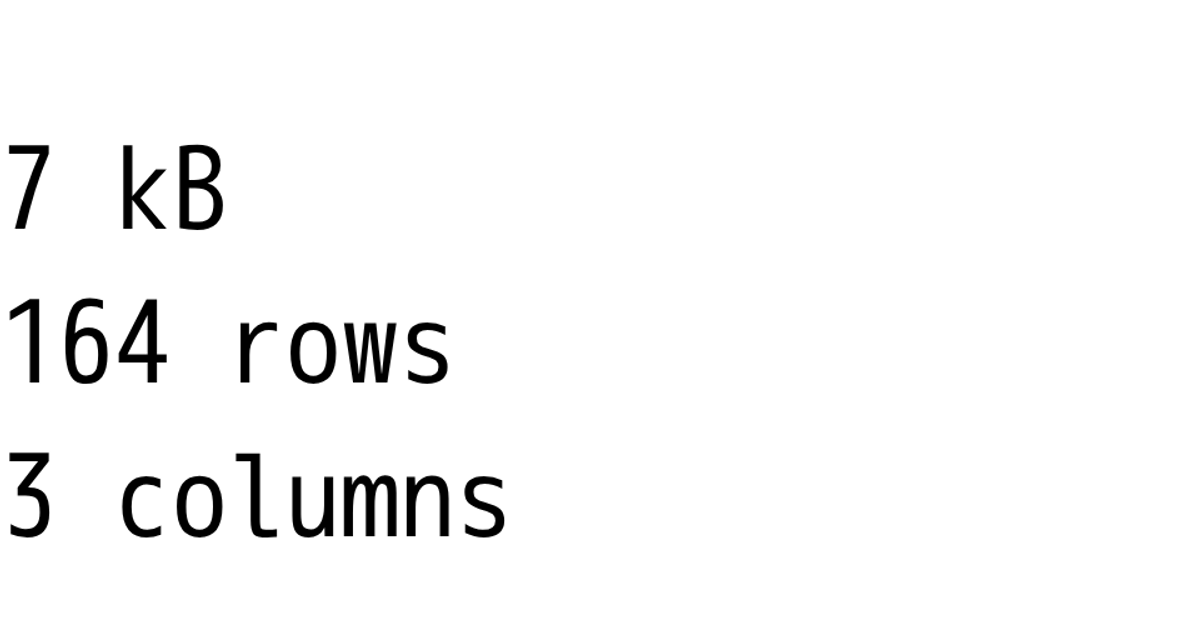
This example displays an SVG image of the TikTok logo above a text summary of a CSV dataset, loaded from a GitHub gist. It uses D3’s `csv` utility to fetch and parse the data, and React (`useState`, `useEffect`) to manage the asynchronous loading state. The message text reports the file size in kilobytes, row count, and column count, computed with `d3.csvFormat` and array properties. The visualization is minimal, focusing on the dataset’s metadata rather than charting its contents.
AI-generated descriptionA program that loads in some data about CSS named colors using D3 utilities, and uses React state to keep track of the data.
MIT Licensed




Comments
Sign in to join the discussion.