🌍 Public
Fork of D3 v5 Zoomable Sunburst - Teja
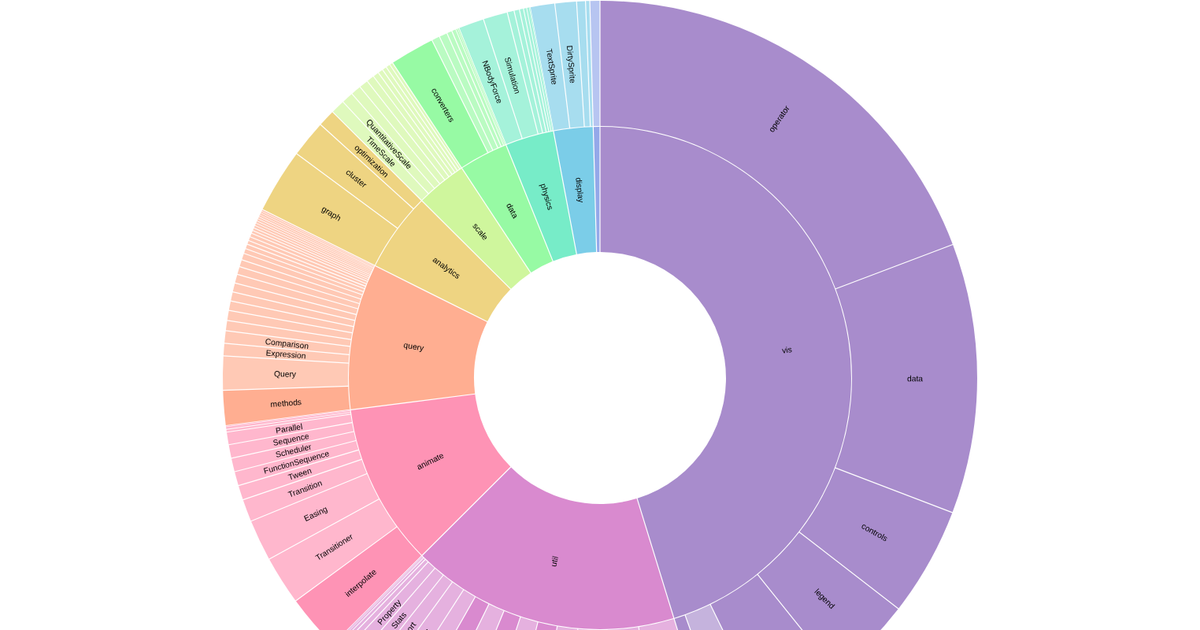
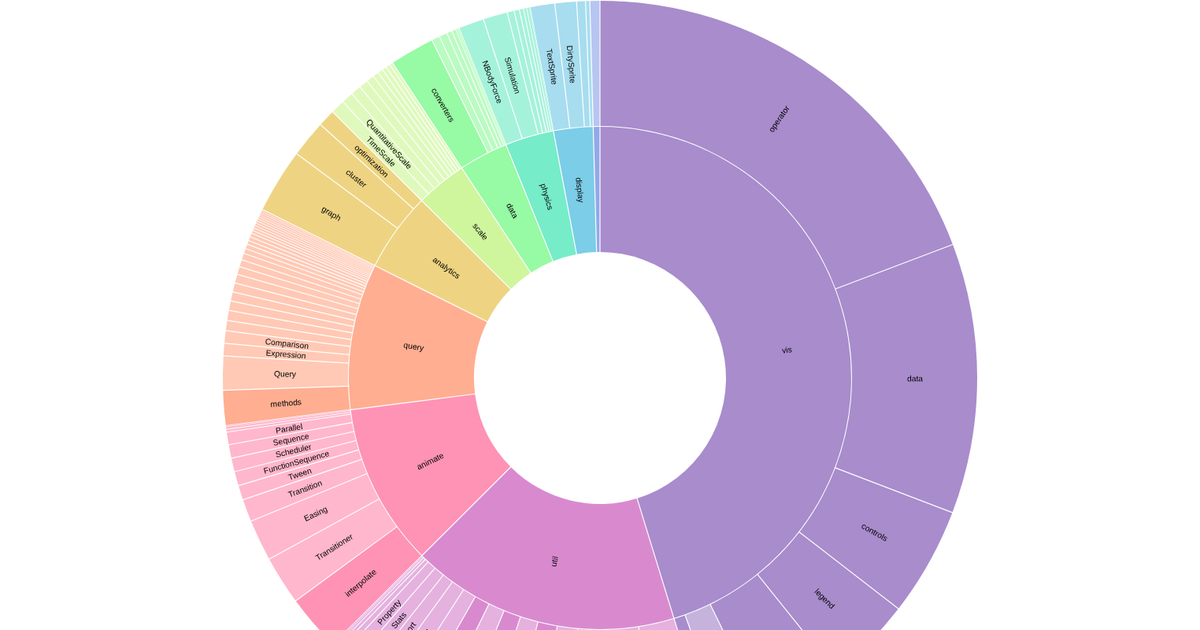
This interactive zoomable sunburst visualizes hierarchical data from the ObservableHq flare dataset, showing the nested structure of a software project’s modules and their sizes. Clicking on a ring segment zooms into that subtree, smoothly animating the partition layout via D3 v5’s `transition` and `attrTween` methods. The visualization uses `d3.hierarchy`, `d3.partition`, and `d3.arc` to compute geometry, with colors assigned per top-level category via `d3.scaleOrdinal` and `d3.interpolateRainbow`. SVG paths and text labels render the rings, with fill-opacity and label visibility toggling based on the current zoom level.
AI-generated descriptionMike Bostock's D3 Zoomable Sunburst example
- with D3 v5 (based on the changes in v5) <br></br> Ported from this Observable notebook for this forum thread. Many thanks to Bryan Gingechen who answered my question about the necessary steps to get from an (Observable) JavaScript notebook to a vanilla JavaScript index.html. He presented his solution on blockbuilder.org
MIT Licensed





Comments
Sign in to join the discussion.