🌍 Public
Make a bar chart
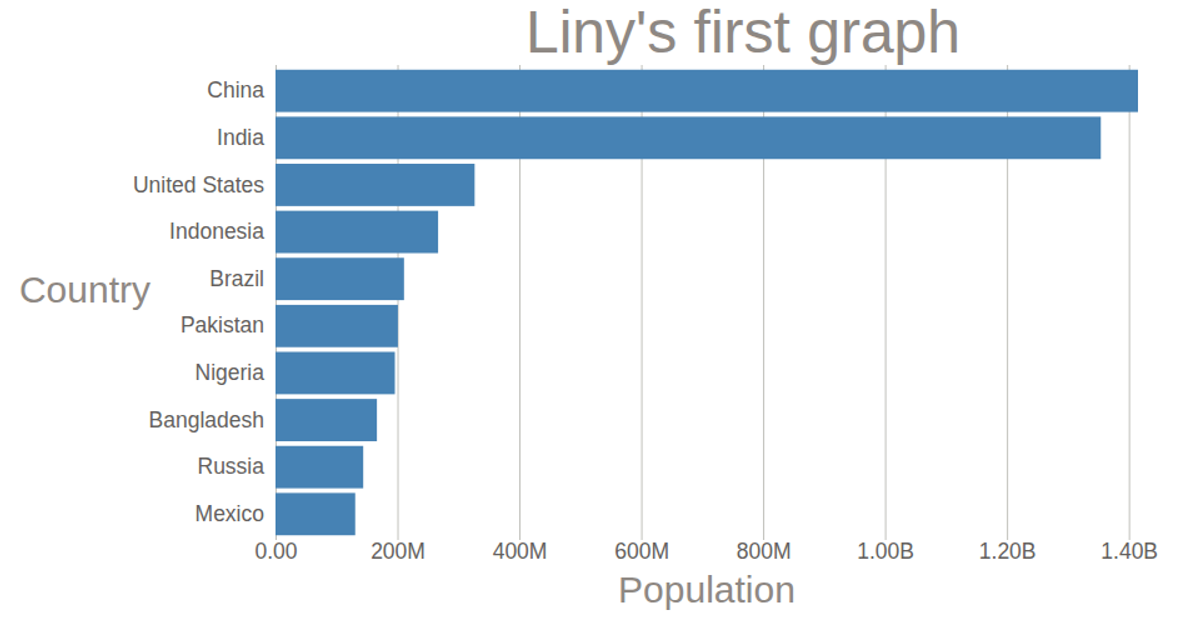
A horizontal bar chart displays 2018 population estimates for ten countries, ranked from China to Mexico. The visualization uses D3.js version 5 with an SVG rendering approach, employing `scaleLinear` and `scaleBand` to map population values and country names to bar dimensions. Data is loaded from a CSV file and multiplied by 1000 to reflect true population counts. Axes are generated with `axisLeft` and `axisBottom`, while a title labels the chart.
AI-generated descriptionMIT Licensed




Comments
Sign in to join the discussion.