🌍 Public
ICE-7_PY_AreaChart
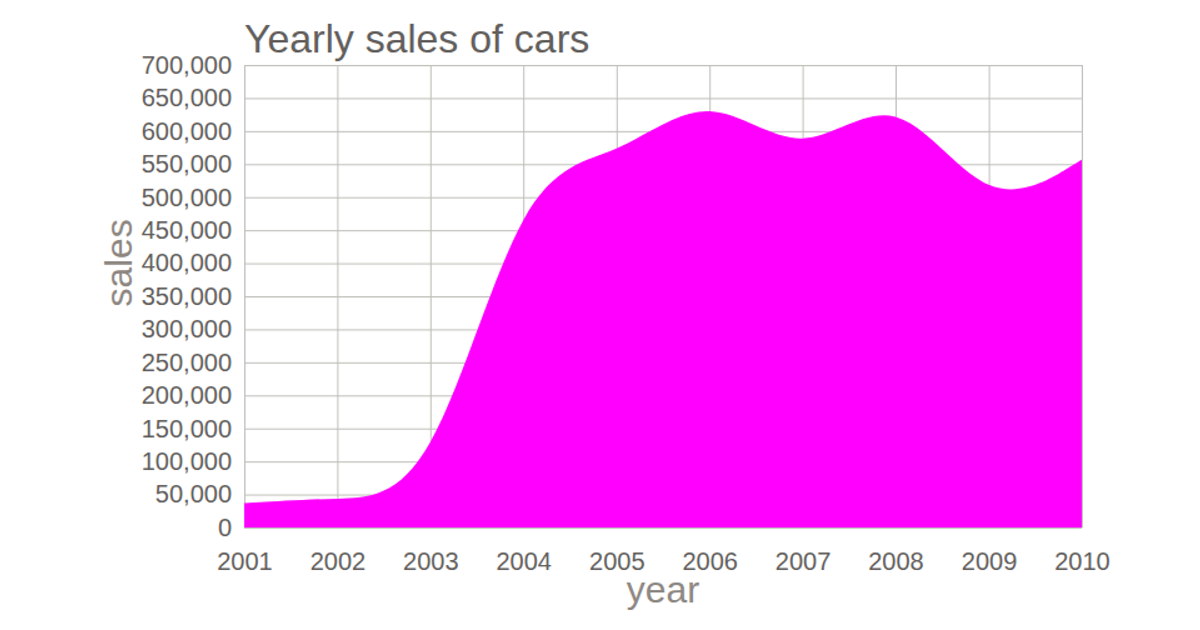
This area chart visualizes insurance policy sales in dollars over the months of 2021 using a time-series dataset loaded from a remote CSV file. The chart displays a filled area with a green stroke, using D3 v4’s `d3.area()`, `d3.scaleTime()`, and `d3.scaleLinear()` for the x and y axes. The SVG rendering includes axis labels for months and sales, with data parsed via `d3.timeParse()` and fetched using `d3.csv()`.
AI-generated descriptionA demonstration of how to start using D3 version 6.
MIT Licensed




Comments
Sign in to join the discussion.