🌍 Public
Customsize axes
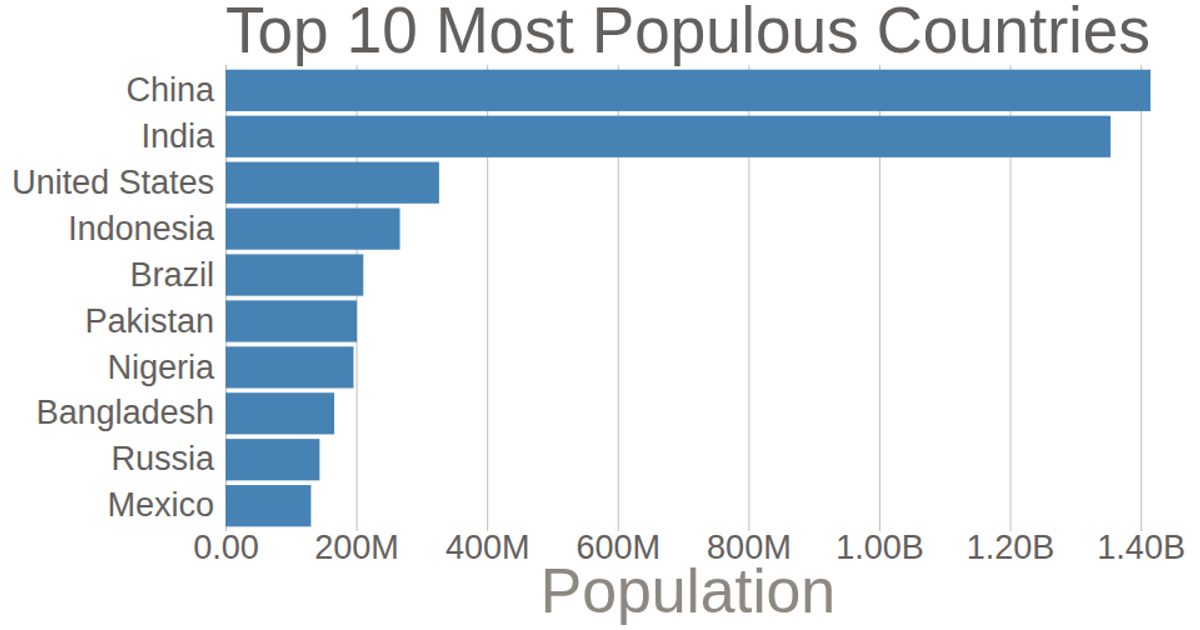
This example displays a bar chart of the top 10 most populous countries using 2018 estimates from the United Nations World Population Prospects. It demonstrates customizing D3 v5 axes, including a bottom axis with formatted tick labels that abbreviate population numbers and remove the domain line, a left axis stripped of its domain and ticks, and custom axis labels. The chart uses `d3.scaleLinear`, `d3.scaleBand`, `d3.axisBottom`, and `d3.axisLeft` to render the SVG visualization.
MIT Licensed




Comments
Sign in to join the discussion.