🌍 Public
Area_Chart_Question2
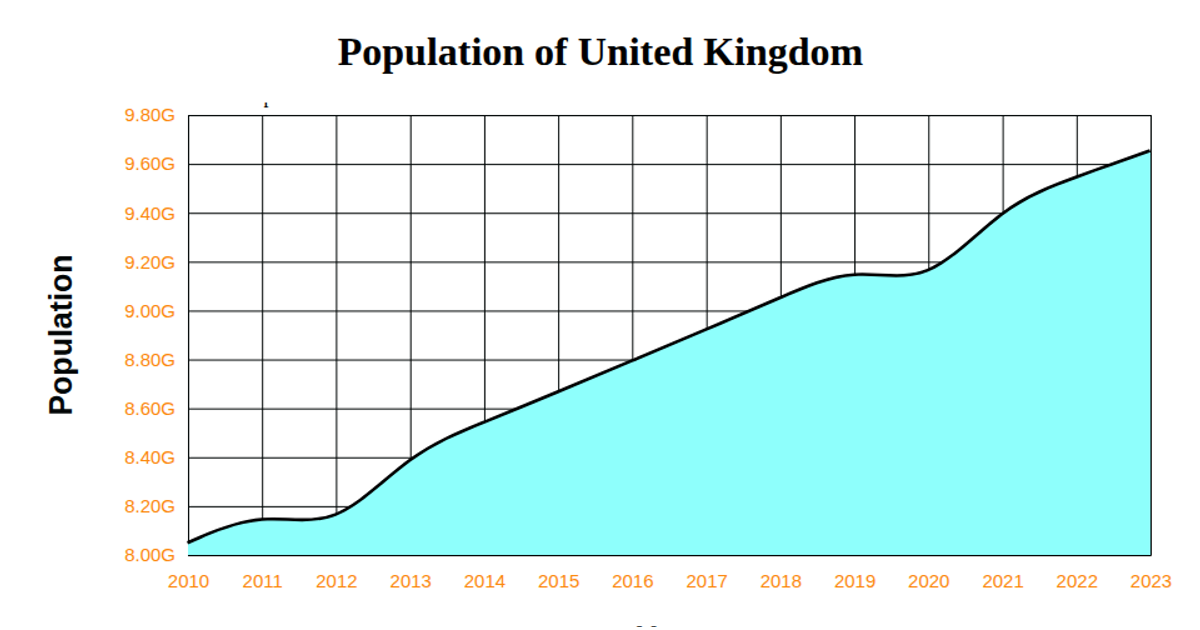
This area chart displays the population of the United Kingdom from 2010 to 2023. The visualization uses D3.js v5 to render an SVG with a time-scaled x-axis and a linear y-axis for population counts. The chart features a smooth basis-curve line and a filled area beneath it, with data loaded from a local CSV file. Axis labels, tick formatting, and chart styling are all handled through D3's scale, axis, and shape-generator APIs.
AI-generated descriptionA reusable scatter plot inspired by Towards Reusable Charts.
Shows the Iris Dataset.
MIT Licensed


Comments
Sign in to join the discussion.