🌍 Public
World Map
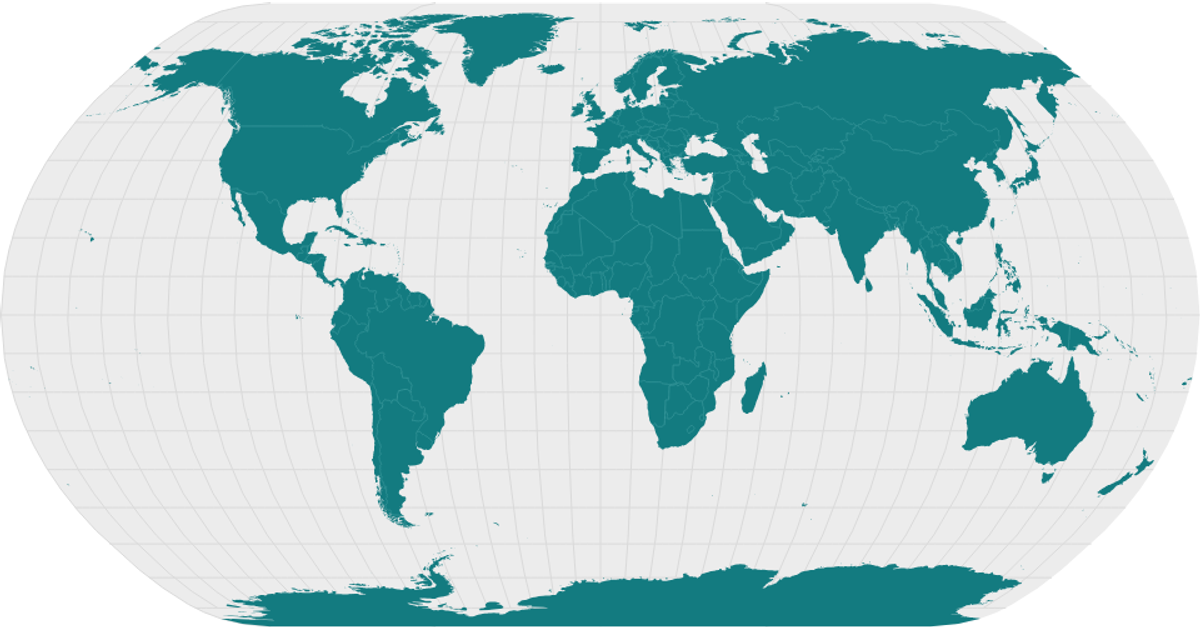
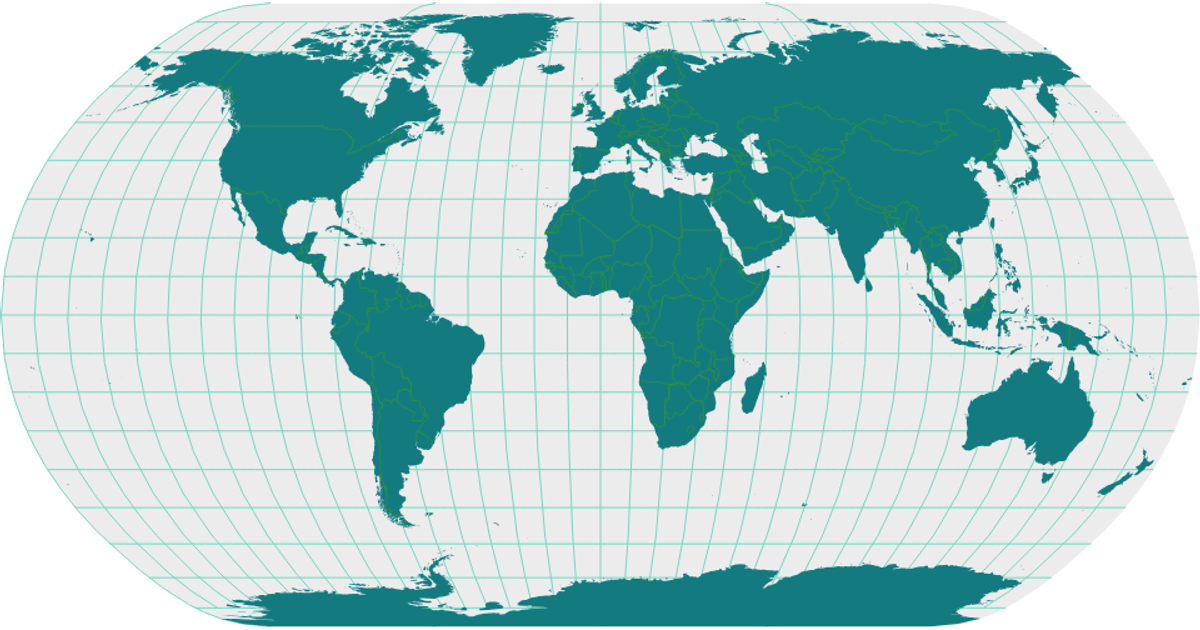
This interactive world map uses the Natural Earth dataset to visualize country boundaries and graticules. Rendered with SVG via React, it employs d3.geoNaturalEarth1 for projection, d3.geoPath for drawing, and topojson’s feature and mesh functions to process the geospatial data. The visualization displays land masses in teal, a light sphere background, and subtle gray graticule and interior boundary lines. Loading state is handled through React’s useState, with asynchronous data fetching via d3.json.
AI-generated descriptionA scatter plot of Data Canvas Sense Your City Dataset.
MIT Licensed




Comments
Sign in to join the discussion.