Global Poverty Levels Over Time
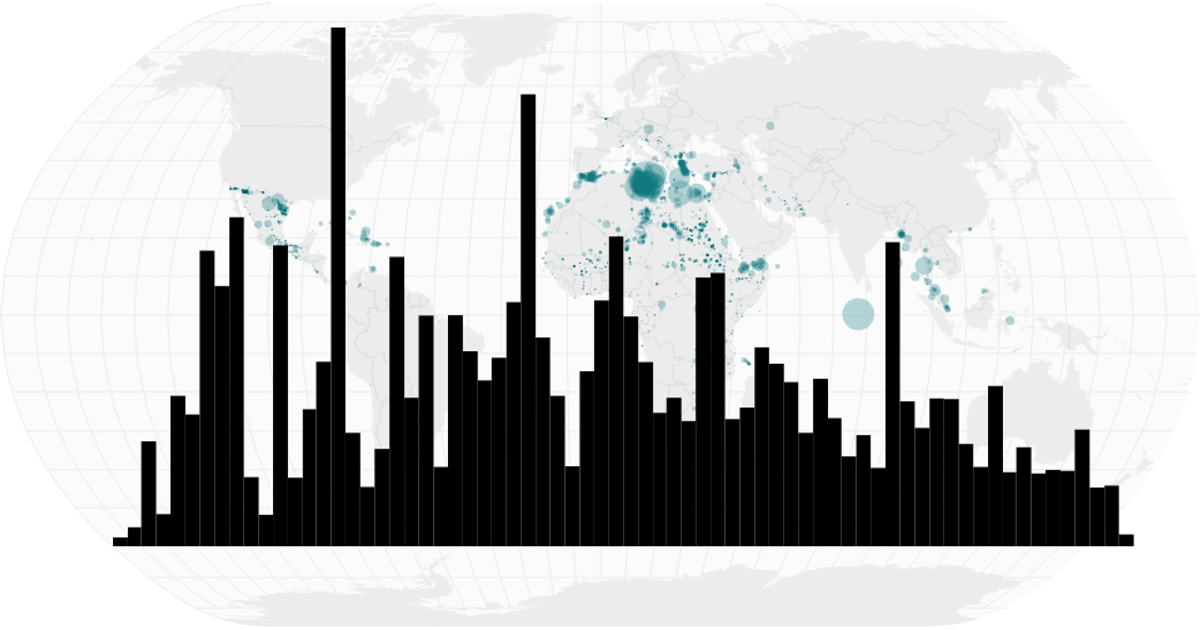
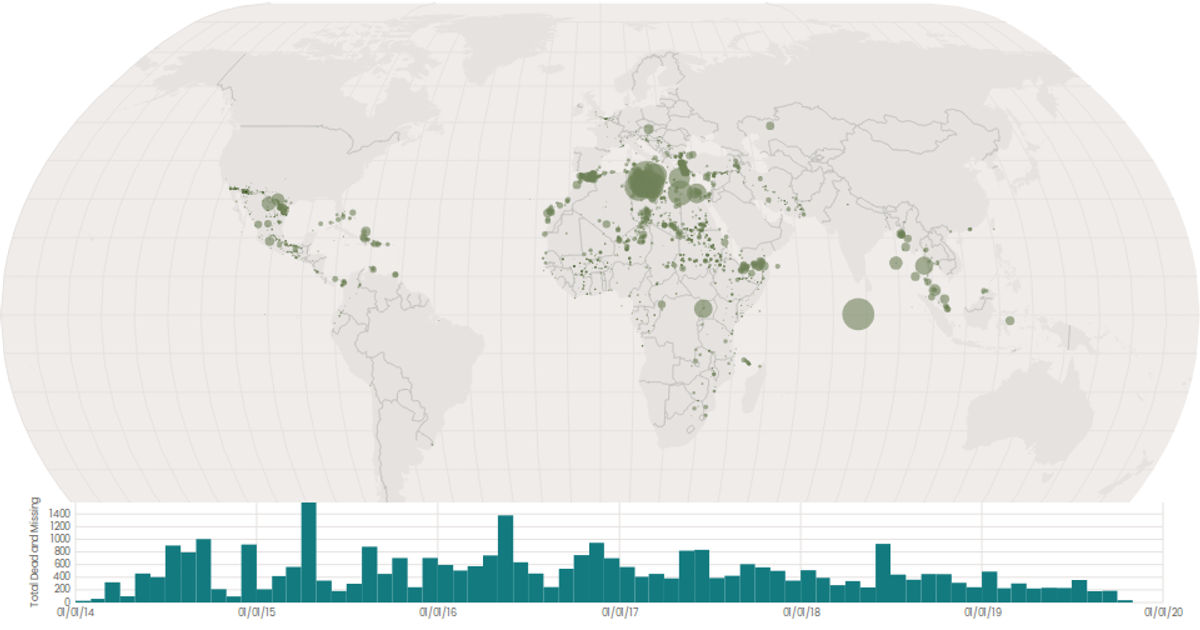
This visualization combines a bubble map with a time-series histogram to show global patterns of missing migrants over time. The map projects circles sized by the total dead and missing using d3.geoNaturalEarth1 and d3.geoPath, while the histogram bins reported dates by month with d3.histogram and a brushX selection filters the map. Data comes from a CSV of Missing Migrants Global records, with country boundaries from World Atlas TopoJSON. React manages state and renders the SVG, with d3.scaleSqrt controlling circle radii.
AI-generated descriptionA world map showing cities with population greater than 50,000. City data from Simplemaps: World Cities Database.
Country boundaries from World Atlas TopoJSON, polished for visual style, including graticules.
This iteration is optimized for performance using React's useMemo hook.




Comments
Sign in to join the discussion.