🌍 Public
Students by wanted city
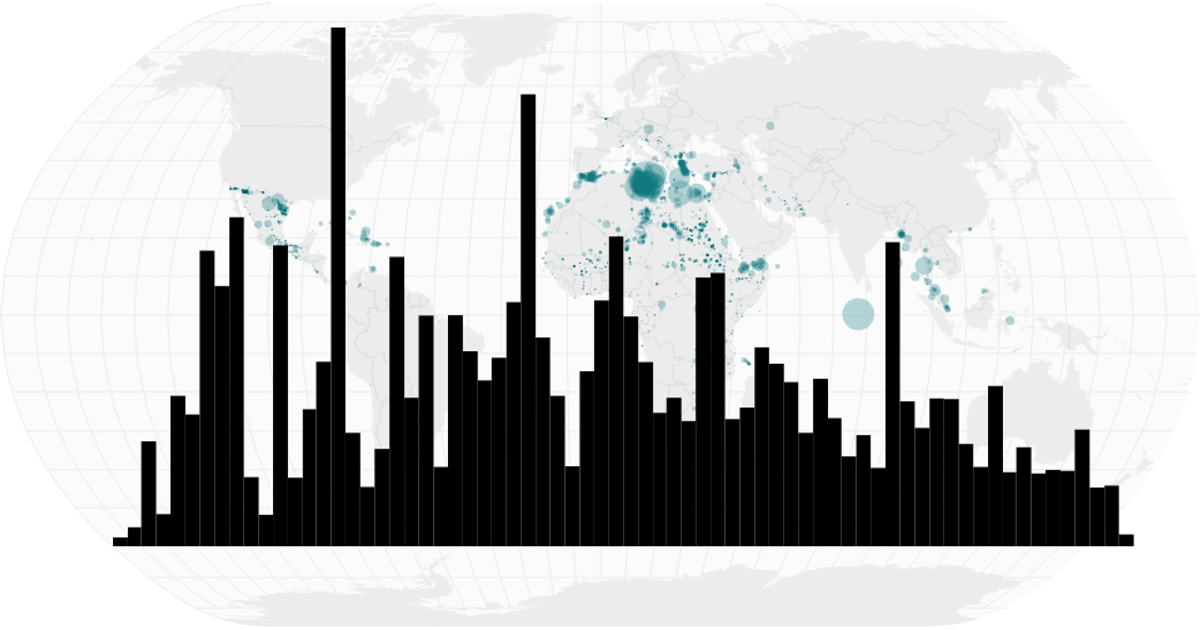
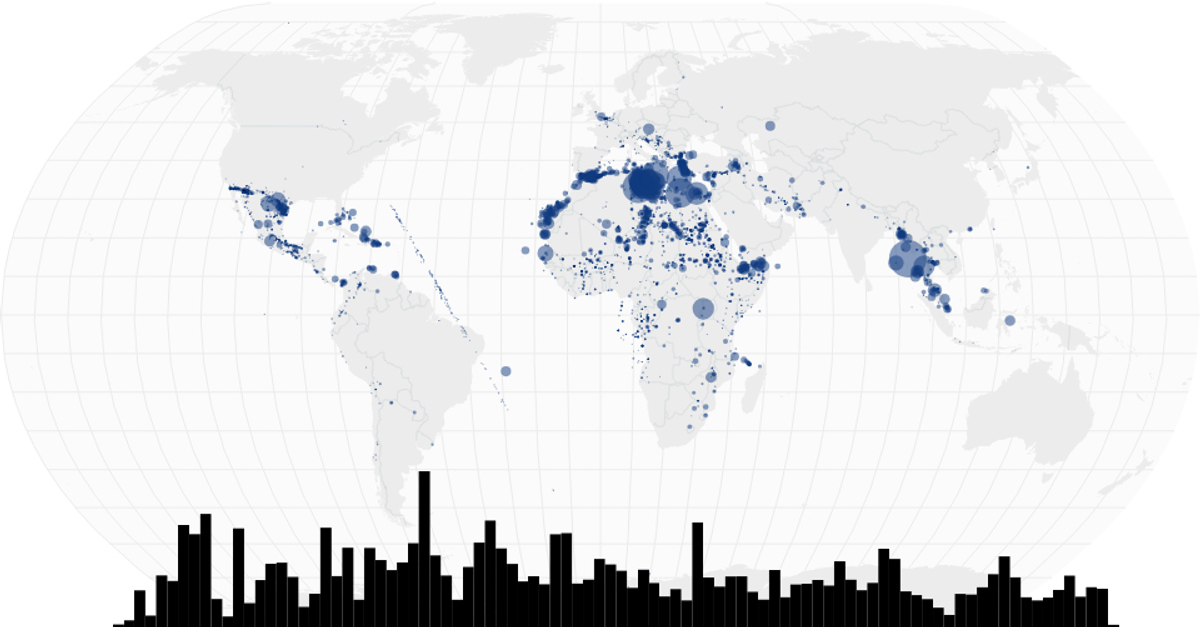
This interactive visualization combines a world map with a time-series histogram to explore migrant deaths and disappearances. The map displays circles sized by the total dead and missing for each location, using a square root scale, while the histogram shows monthly totals. Users can brush over the histogram to filter the map’s data. Built with React and D3 v5, it uses `geoNaturalEarth1` and `geoPath` for map rendering, and `brushX` for filtering. Data comes from the Missing Migrants Project CSV.
AI-generated descriptionA world map showing cities with population greater than 50,000. City data from Simplemaps: World Cities Database.
Country boundaries from World Atlas TopoJSON, polished for visual style, including graticules.
MIT Licensed






Comments
Sign in to join the discussion.