🌍 Public
Fork of ICE-6: Rendering Marks and Channels with React & D3
DDanthalakirankumar
Last edited Mar 5, 2022
Created on Mar 5, 2022
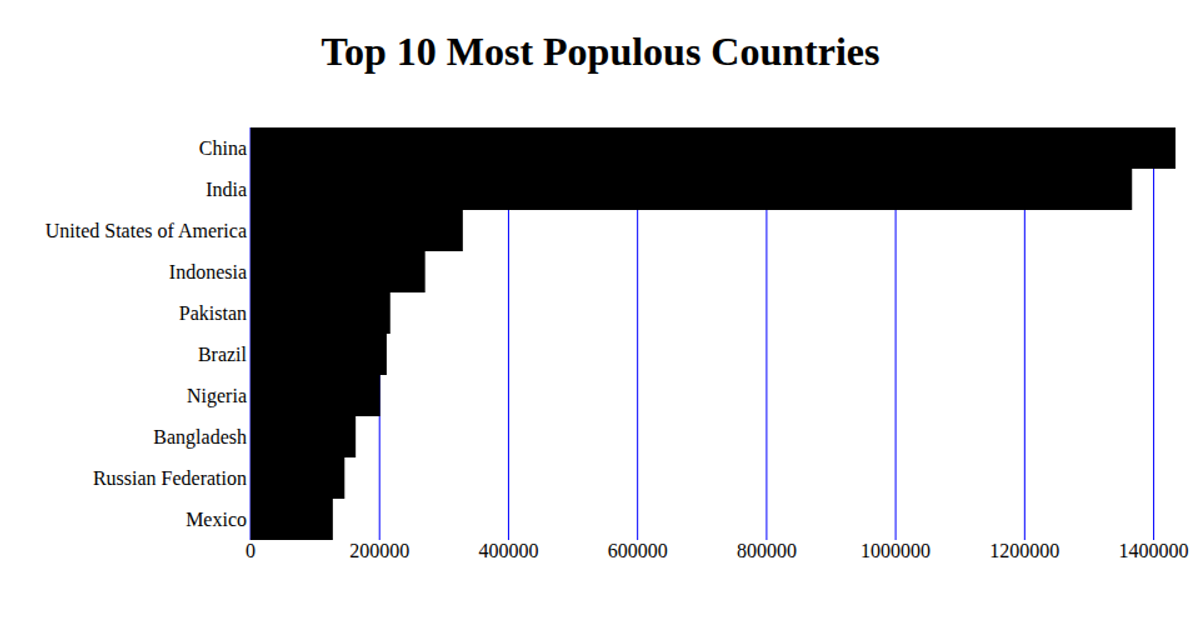
This bar chart displays the top 10 most populous countries, loading data from a CSV file containing 2019 population figures. The visualization renders as an SVG using React components that map country names to a band scale and population values to a linear scale. The code leverages React hooks like `useState` and `useEffect` alongside D3 utilities including `csv`, `scaleBand`, `scaleLinear`, and `max` to fetch, parse, and visually encode the dataset.
AI-generated descriptionA bare minimum HTML page demonstrating use of CSS and JavaScript.
See also React Starter.
MIT Licensed




Comments
Sign in to join the discussion.