🌍 Public
JS Bin
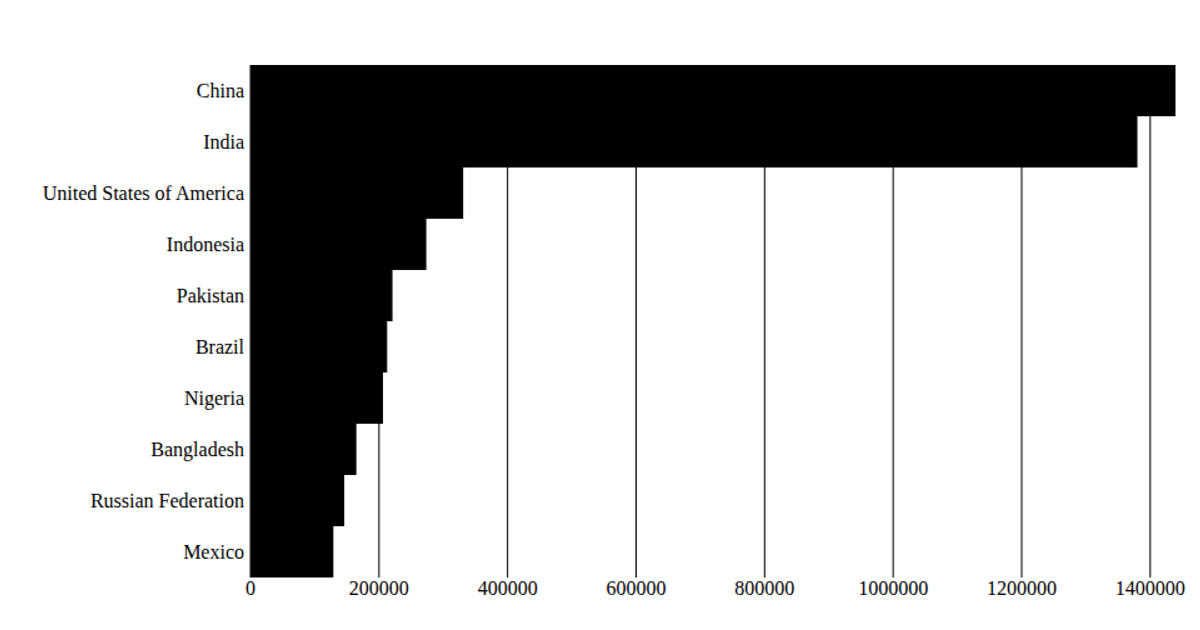
A horizontal bar chart displays population figures for ten countries, with bar lengths proportional to each value from `data.csv`. The SVG graphic maps country names to the y-axis and population counts to the x-axis using D3 v6's `scaleLinear` and `scaleBand`. The React-based code loads data via `d3.csv`, multiplies population values by 1000, and appends rectangles to the SVG with the `enter` selection.
AI-generated descriptionA bare minimum HTML page.
See also React Starter.
MIT Licensed




Comments
Sign in to join the discussion.