🌍 Public
Fork of Choropleth Map
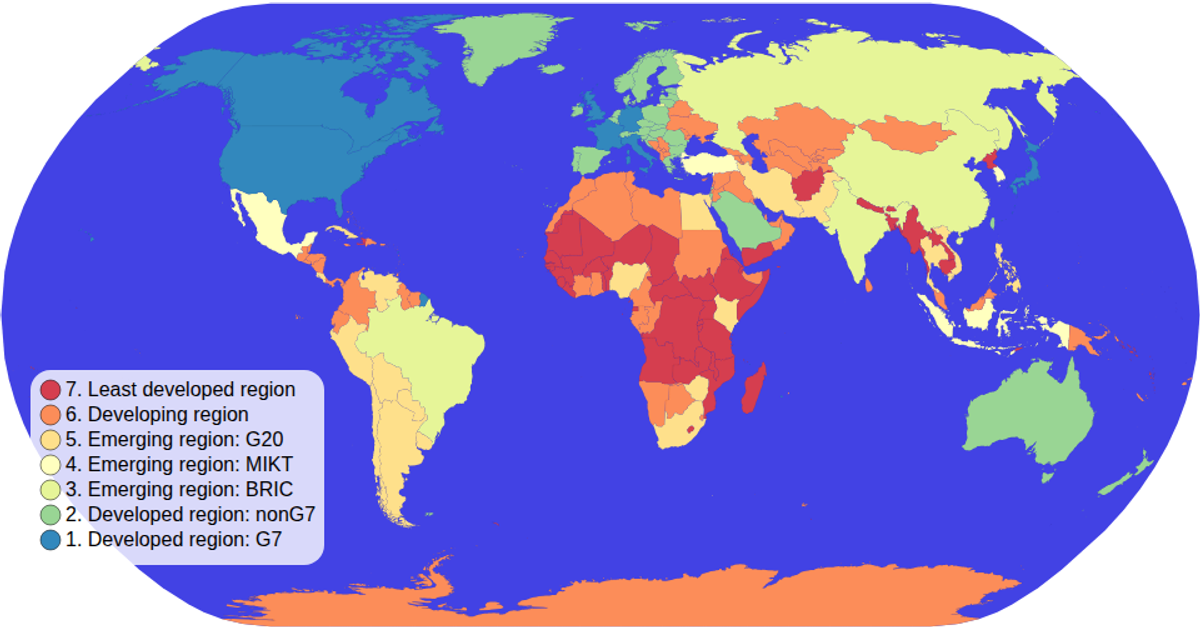
This example shows a natural Earth choropleth map where each country is colored by its economy category from a global dataset. Users can pan and zoom through the SVG map using d3.zoom, while a color legend built with ordinal scales and schemeSpectral displays the available classifications. The visualization loads TopoJSON world-atlas data, joins TSV attributes, and renders countries via d3.geoPath with hover effects that highlight individual states.
AI-generated descriptionMIT Licensed



Comments
Sign in to join the discussion.