🌍 Public
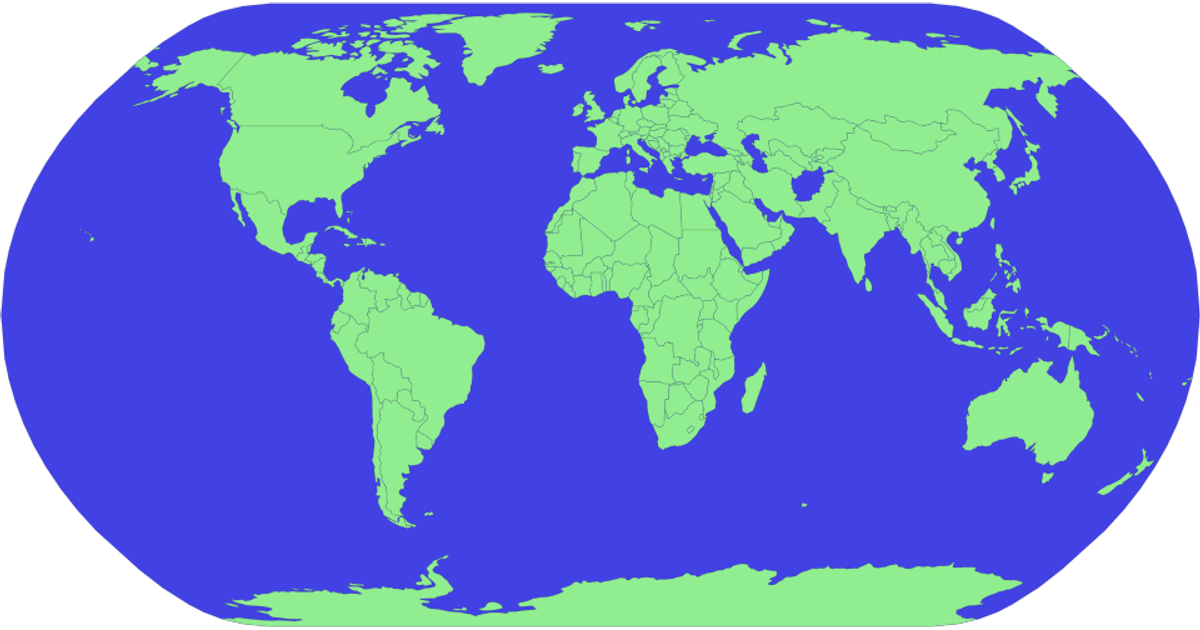
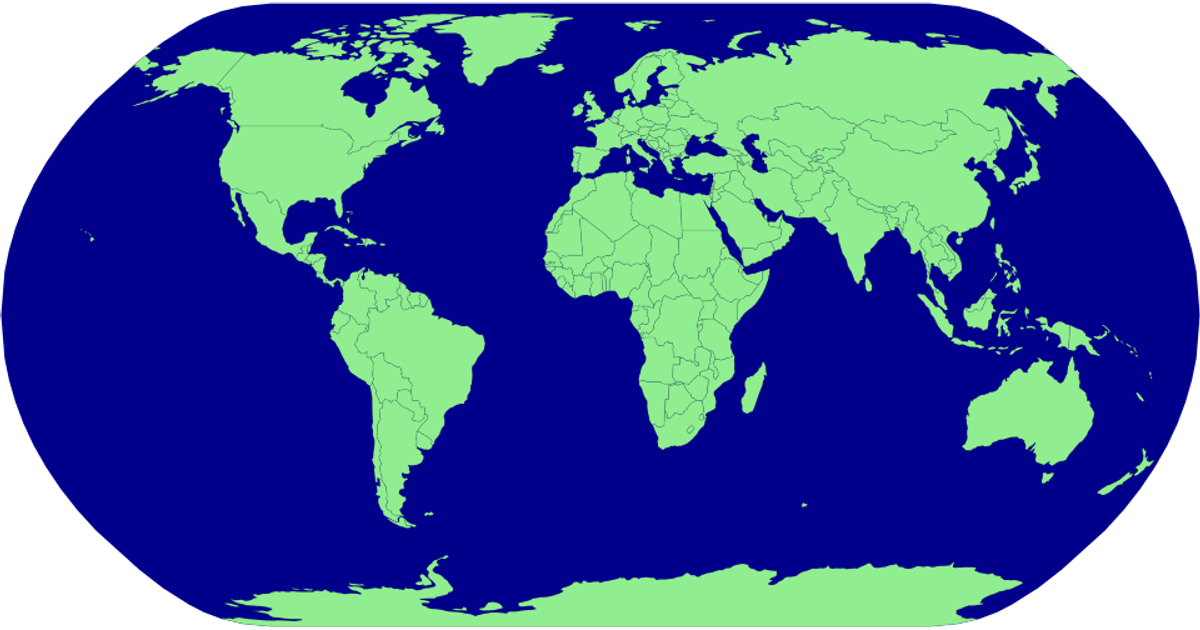
Let's make a map with D3.js!
This example visualizes a world map using D3.js, with countries rendered as light green shapes against a blue sphere. The map is built using the `geoNaturalEarth1` projection and `geoPath` generator, while TopoJSON data is loaded from the world-atlas package. The code also includes a partially implemented `Heatmap` class that creates SVG containers, though it does not yet render any heatmap content.
AI-generated descriptionMIT Licensed





Comments
Sign in to join the discussion.