🌍 Public
Fork of ICE - 7 Pie Chart OTT and subscription
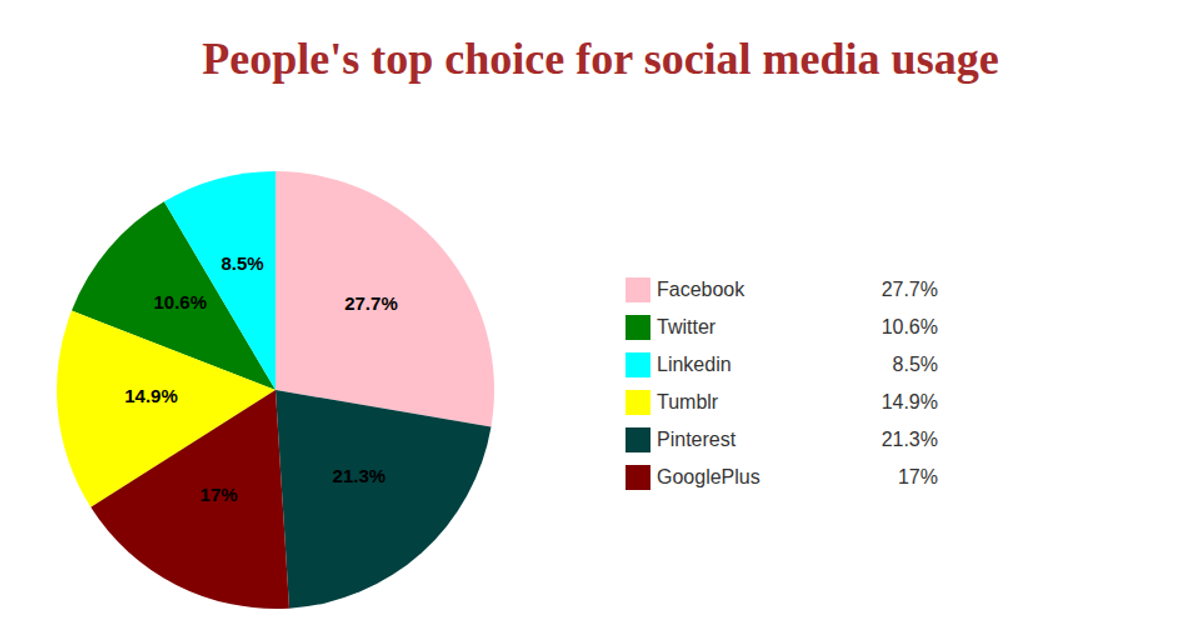
This visualization presents a pie chart comparing monthly subscription prices in Indian Rupees across various OTT platforms, using data fetched from a GitHub-hosted CSV file. Each slice is labeled with its price, and a color-coded legend identifies the platform names alongside their corresponding rates. The chart is built with React, D3 v5’s `pie()` and `arc()` generators, and `scaleOrdinal` for coloring, rendering in SVG. The code uses asynchronous `csv` loading and `d3.arc` for both slice geometry and centroid-based text placement.
AI-generated descriptionA bare minimum HTML page demonstrating use of CSS and JavaScript.
See also React Starter.
MIT Licensed




Comments
Sign in to join the discussion.