🌍 Public
VIPs
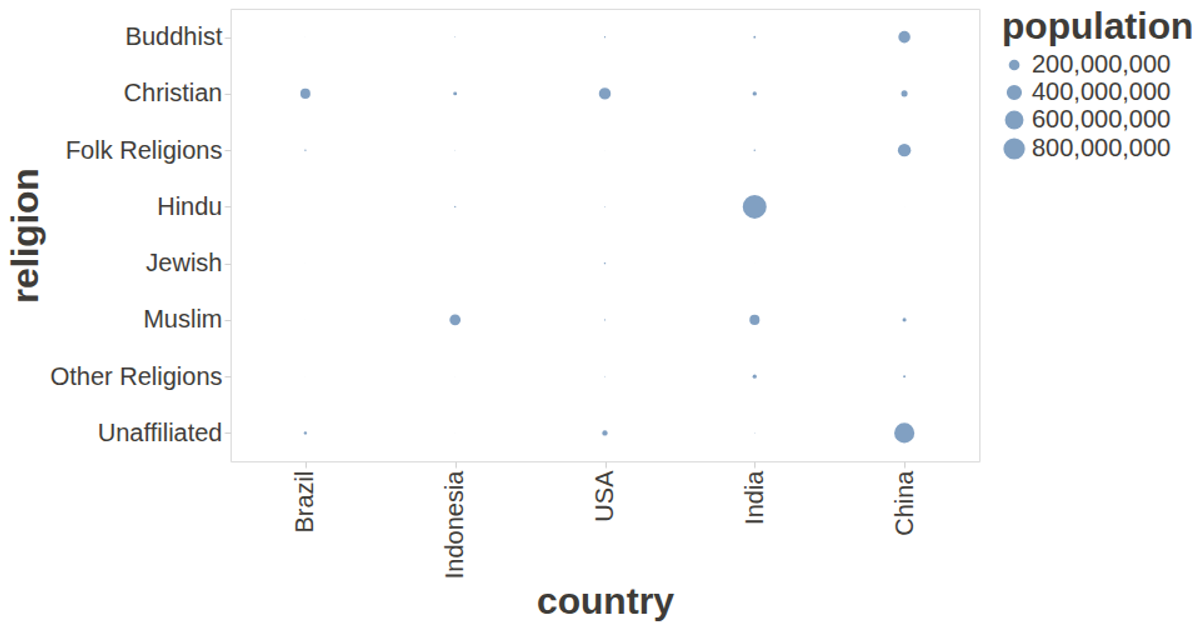
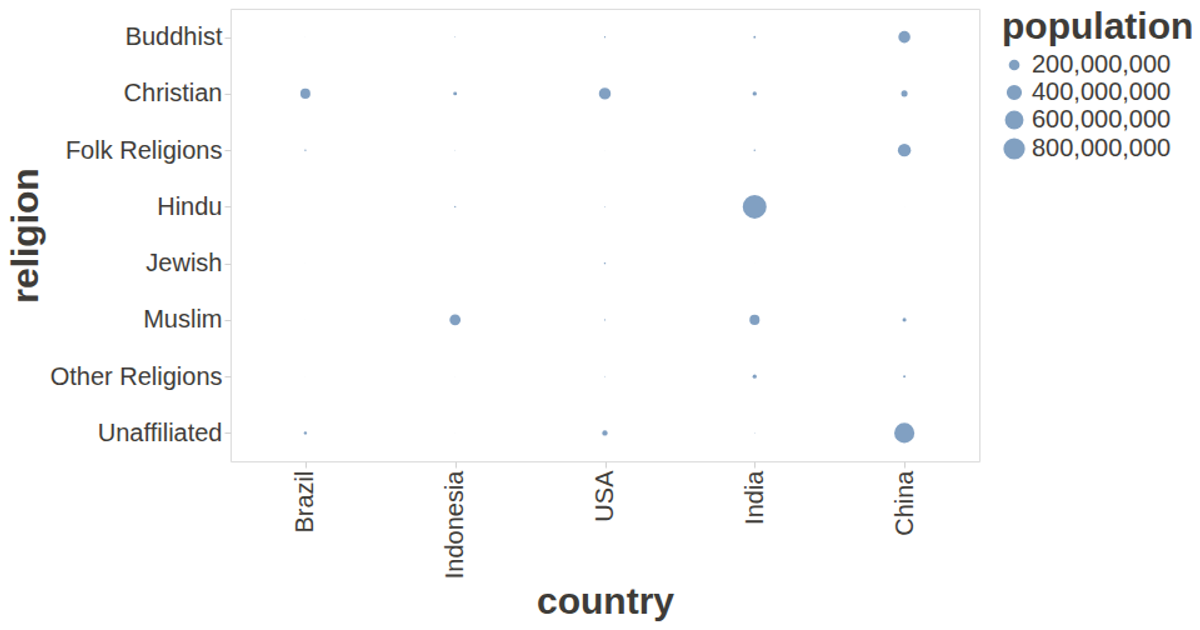
This visualization plots religions against countries as a circular mark chart, with dot size encoding population and tooltips revealing religion names on hover. It uses the vega-lite-api to construct the specification, with vega and vega-lite rendering the visualization, and vega-tooltip for interactive labels. The data comes from a CSV file loaded via d3.csv, and custom styling in the config adjusts font sizes and removes axis domain lines for readability.
AI-generated descriptionA visualization constructed using the vega-lite-api.
MIT Licensed




Comments
Sign in to join the discussion.