🌍 Public
Fork of Stylized Line Chartahmmt
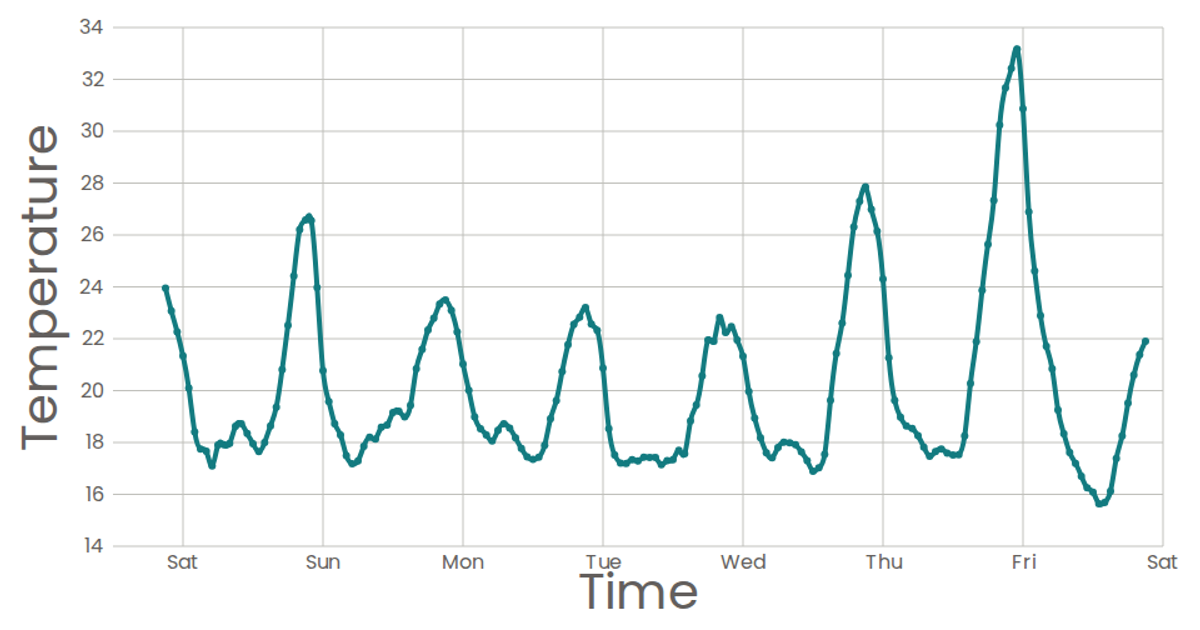
This line chart shows weekly temperature readings in San Francisco over time. The visualization uses a smooth, natural curve to connect data points on a time-based x-axis and temperature-based y-axis, with a simple grid and axis labels. Built with React and D3 v5, the chart employs `scaleTime`, `scaleLinear`, and `curveNatural` to generate the path. It reads CSV data from the Data Canvas Sense Your City dataset, with a minimal loading state and no interactive tooltips.
AI-generated descriptionA scatter plot of Data Canvas Sense Your City Dataset.
MIT Licensed




Comments
Sign in to join the discussion.