🌍 Public
Fork of d3 Updating Bar Chart With Dropdown
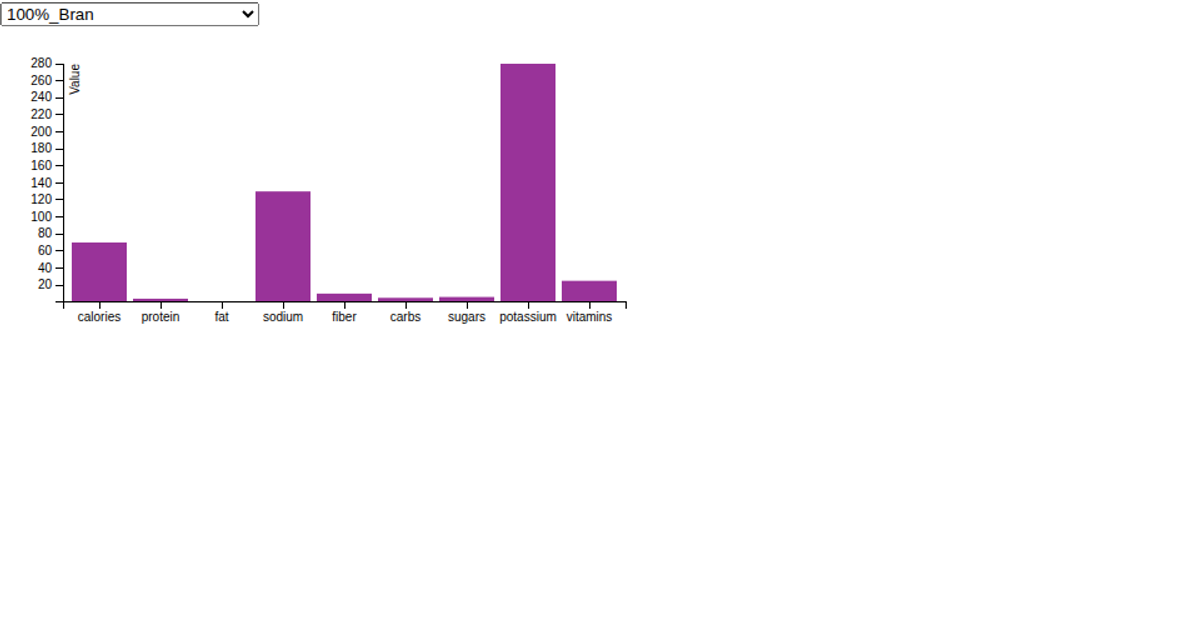
This interactive bar chart visualizes the nutritional content of breakfast cereals. A dropdown menu selects a cereal, and the corresponding values for categories like calories, protein, and fat are displayed as animated bars. The chart uses d3.v3 to render SVG and transitions, with a scale.ordinal for the x-axis and scale.linear for the y-axis. Data is loaded from the cereals.csv file and mapped for each cereal, and the `d3.extent` function updates the y-axis domain on selection.
AI-generated descriptionMIT Licensed



Comments
Sign in to join the discussion.