🌍 Public
Scatter plot with menus
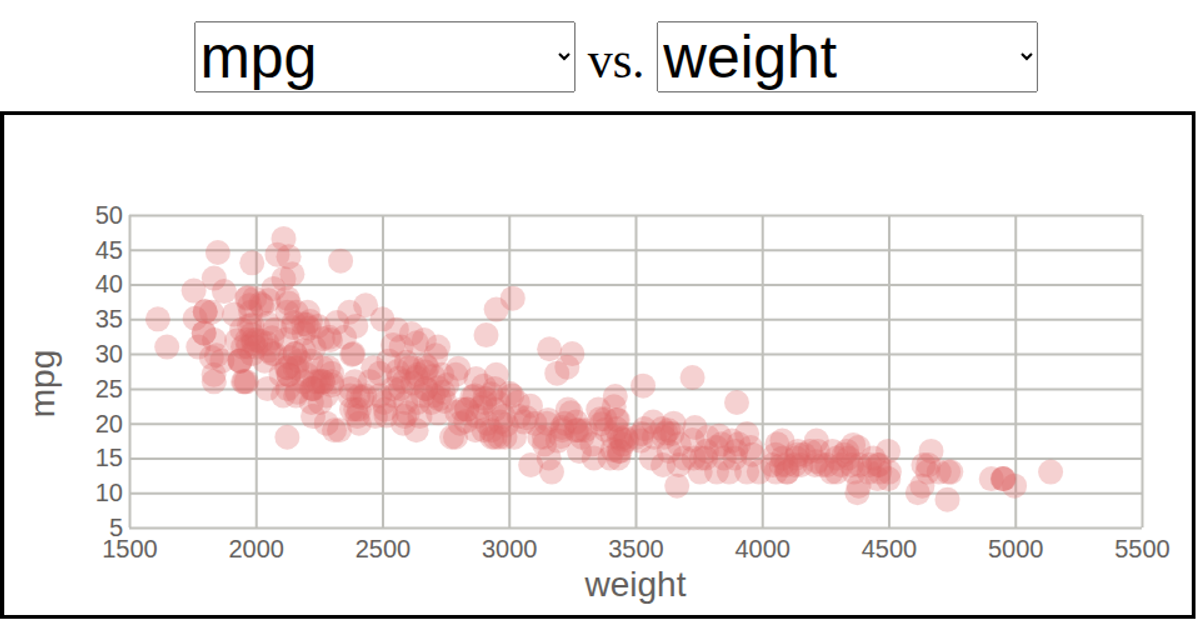
This interactive scatter plot explores relationships between attributes of classic automobiles, drawing from the auto-mpg dataset. Two dropdown menus allow users to select which columns appear on the x- and y-axes, triggering a smooth animated transition of the points. Built with D3 v5, the example uses `scaleLinear`, `extent`, `axisLeft`, and `axisBottom` to construct the axes, while the points are animated using `.transition().duration().delay()`. The chart is rendered as SVG, with a reusable dropdown module and a separate scatterplot module handling the visualization logic.
AI-generated descriptionMIT Licensed







Comments
Sign in to join the discussion.