🌍 Public
Fork of HIV/AIDS Choropleth Map
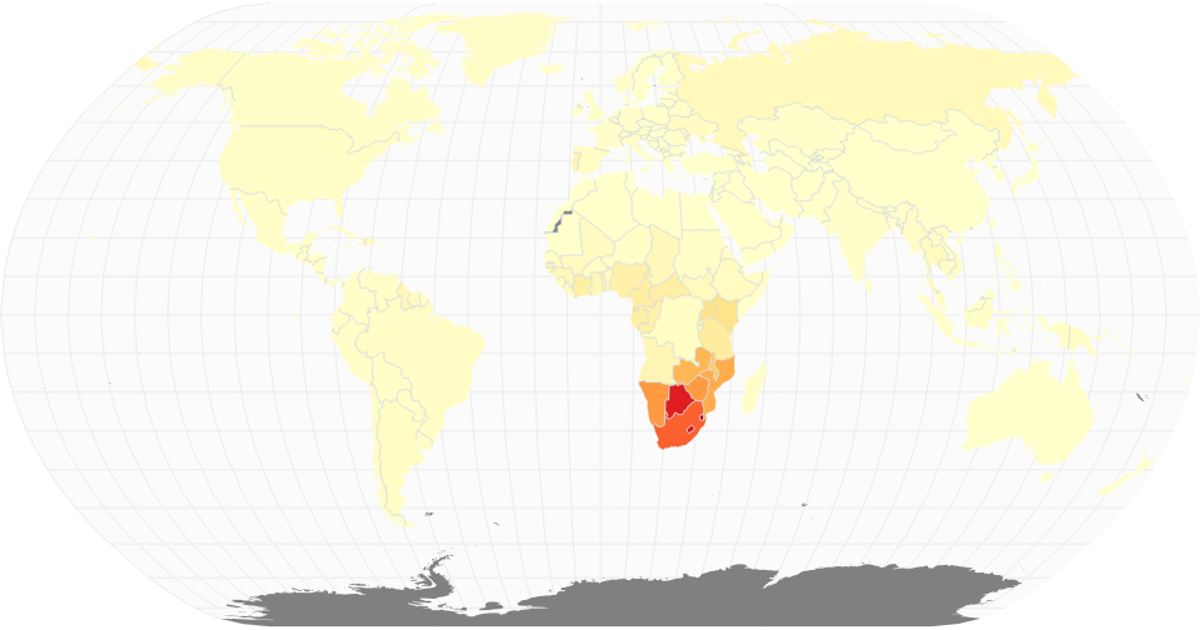
This choropleth map visualizes the share of the population infected with HIV/AIDS for the year 2017, using a yellow-orange-red sequential color scale. Country boundaries and graticules are rendered as SVG paths via `d3.geoPath` and `geoNaturalEarth1`, with React managing the component structure. Data comes from an IHME CSV, joined to country geometries using ISO numeric codes. The visualization is a fork of a prior example, adapting city population data to HIV prevalence rates.
AI-generated descriptionA world map showing cities with population greater than 50,000. City data from Simplemaps: World Cities Database.
Country boundaries from World Atlas TopoJSON, polished for visual style, including graticules.
MIT Licensed




Comments
Sign in to join the discussion.