🌍 Public
Fork of Let's make a map with D3.js!
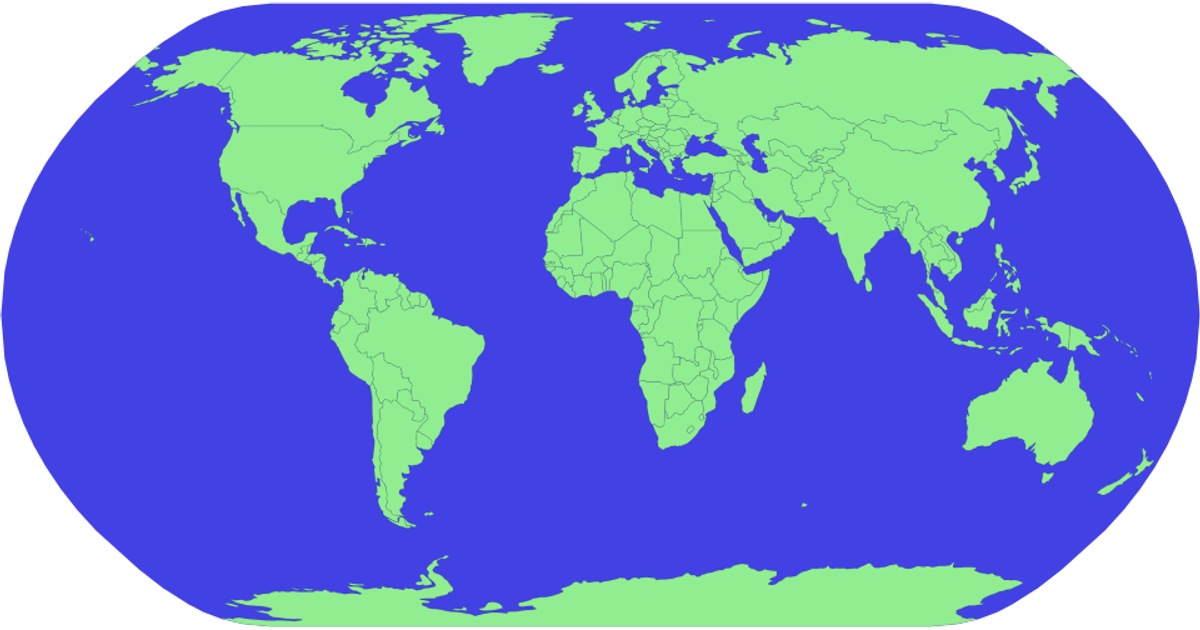
This visualization combines a D3.js v4 Mercator projection map of world countries with layered pie charts representing water quality data from a CSV. The map renders landmasses in green with white mesh borders, while each data point uses a red circle and an overlaid pie chart built with `d3.pie` and `d3.arc`. Country boundaries are generated using the `topojson` library on a world-atlas GeoJSON source, and the pie charts’ angles reflect the comma-separated values in the `data` field. The color scheme for the slices comes from `d3.schemeCategory10`.
AI-generated descriptionMIT Licensed




Comments
Sign in to join the discussion.