🌍 Public
Task9_AreaChart
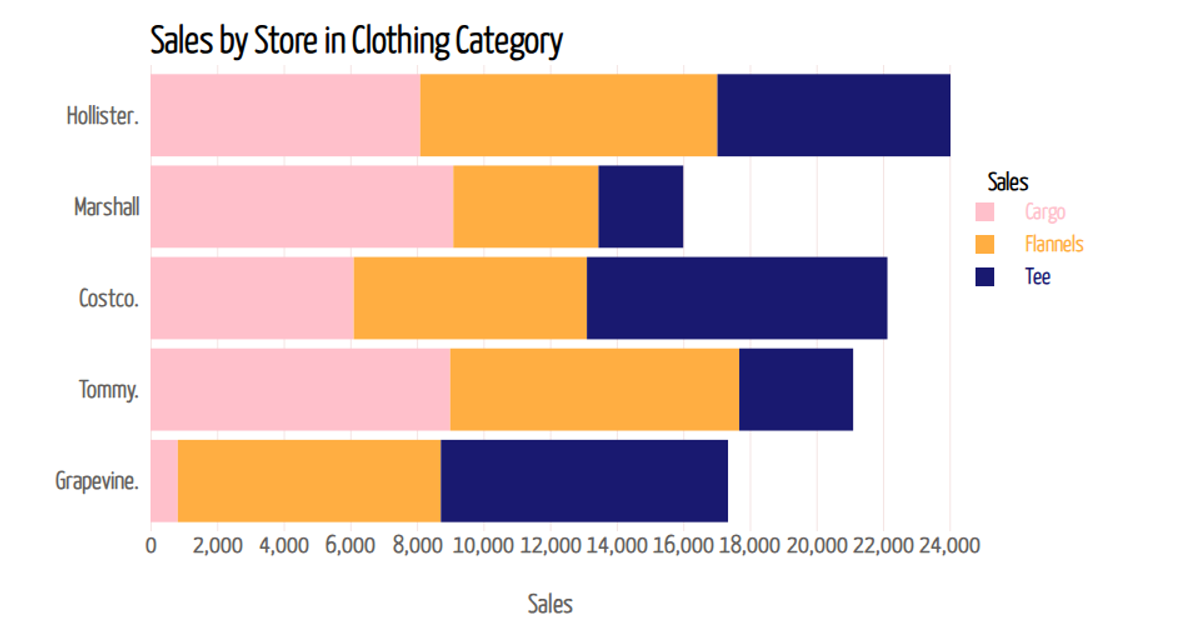
This stacked bar chart visualizes sales, profit, and shipping costs across three shipping categories (Same Day, Second Class, First Class). The visualization uses D3.js version 7 to stack the three metrics for each category, using `d3.stack()` and `d3.scaleBand()` for the categorical x-axis. The data is embedded directly in the JavaScript code, and each bar segment is colored distinctly via a `d3.scaleOrdinal()` color scheme, with hover effects defined in the CSS.
AI-generated descriptionA bare minimum HTML page.
MIT Licensed




Comments
Sign in to join the discussion.