🌍 Public
3D SCATTER PLOT FOR IPHONE AND ITS CASE
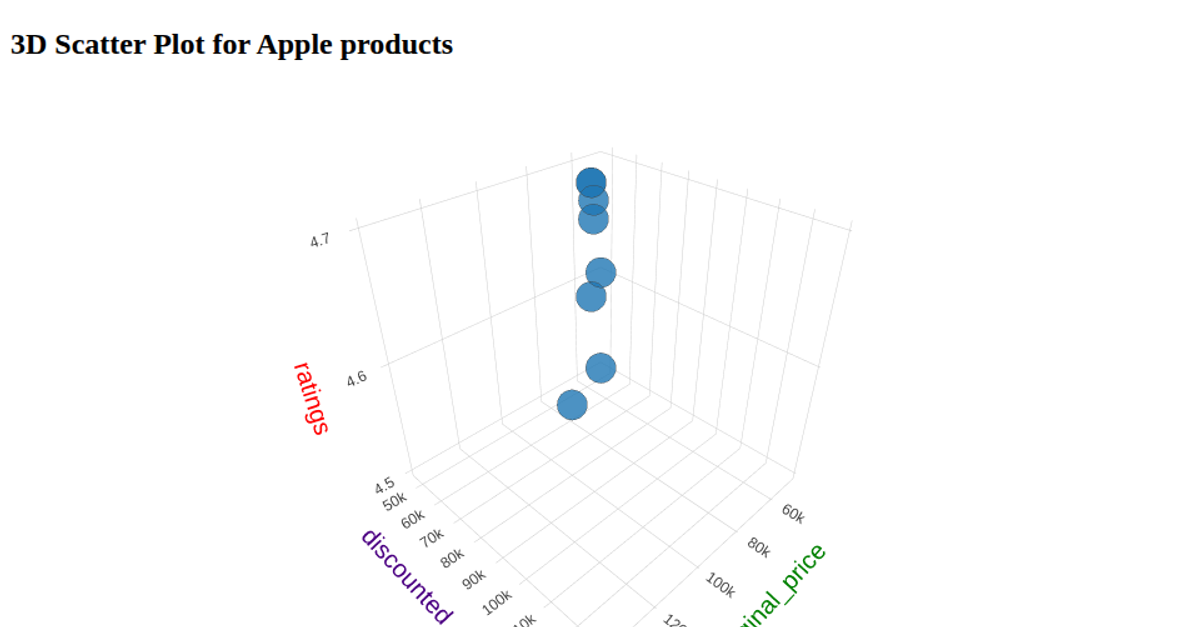
This 3D scatter plot visualizes the relationship between iPhone dimensions and its case measurements using two Plotly trace objects. It displays iPhone length and width on the X and Y axes, while tracking both case length (gray markers) and case width (green markers) along the Z axis. The code loads phone data from a CSV file using D3’s `d3.csv` function, then constructs the visualization with `Plotly.newPlot`. Each trace uses the `scatter3d` type with circle markers and distinct colorations to differentiate between the two case dimensions being plotted.
AI-generated descriptionThis viz is a starter that demonstrates patterns used in real world projects in which complexity is anticipated to scale.
- Decoupled React & D3 integration
- Opening moves for scalable complexity
- Industry standard ES modules and JSX
- Copy-paste into existing projects
Any questions? Ask on Twitter!
Also viewable in:
MIT Licensed



Comments
Sign in to join the discussion.