🌍 Public
POwer Distribution in INDIA Network Graph
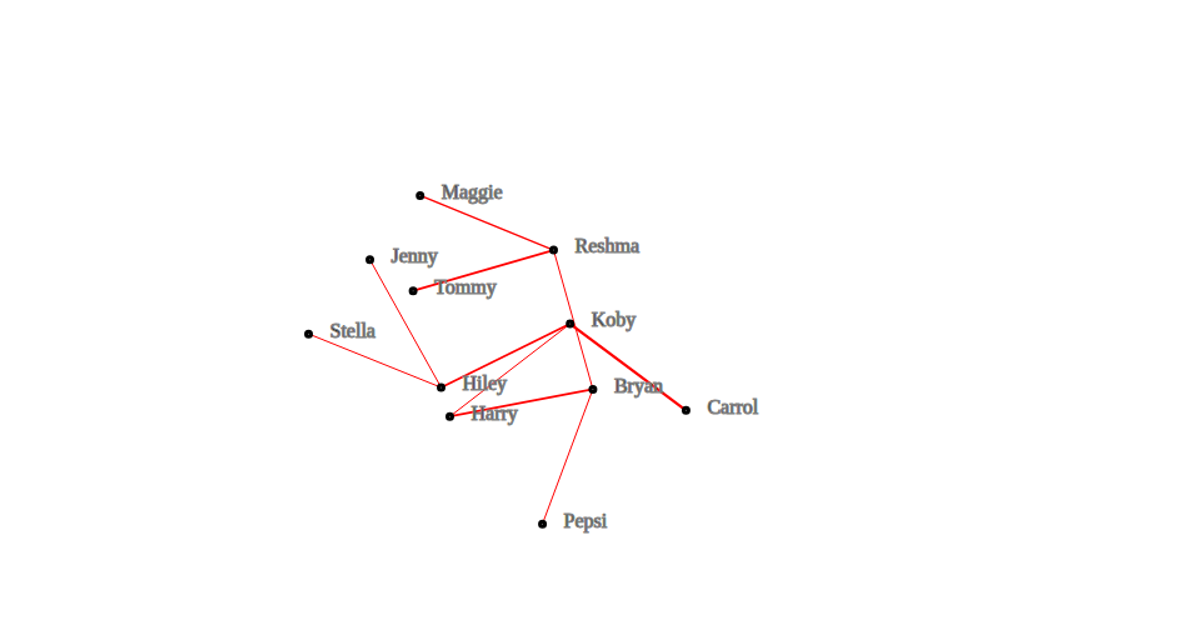
A force-directed network graph illustrates power distribution in India, mapping seven roles from President and Prime Minister to IAS, IPS, IRS, and the Public. Node links vary in thickness based on assigned weight, suggesting relationship strength. Built with D3.js v4, the visualization uses `d3.layout.force` for simulation and renders nodes as stylized SVG circles with text labels. The data is loaded from a local `graphFile.json` file containing nodes and weighted links, and users can interactively drag nodes through the force layout's drag behavior.
AI-generated descriptionMIT Licensed




Comments
Sign in to join the discussion.