🌍 Public
Activity6_Task3
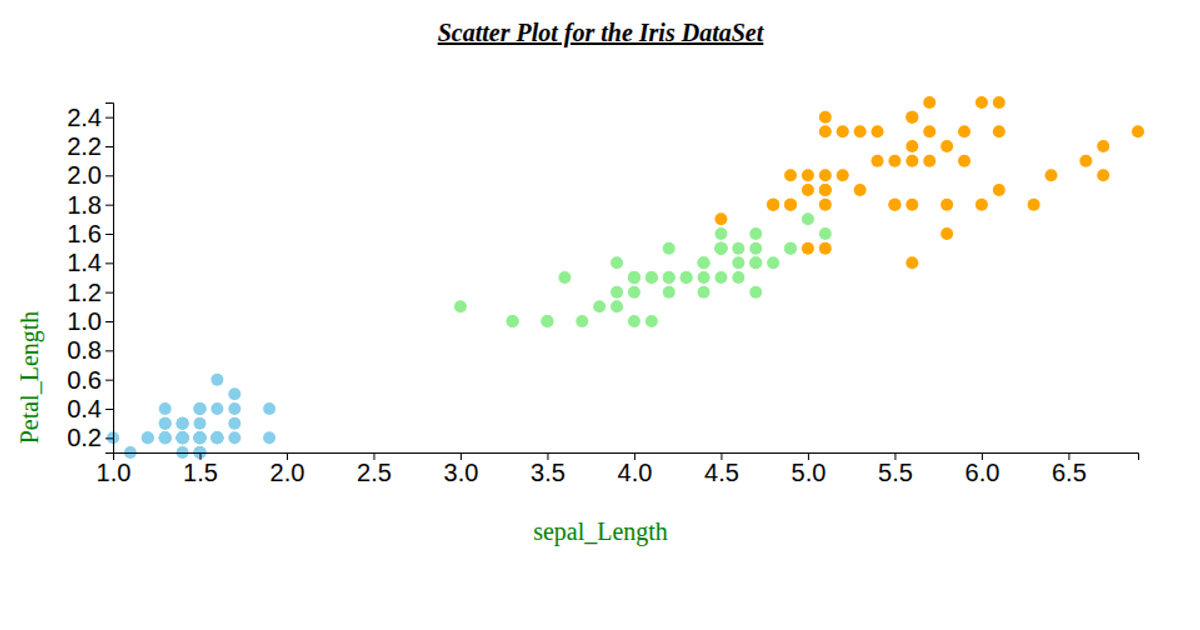
This D3.js scatter plot visualizes the Iris dataset, plotting petal length against petal width for all samples. Points are colored by species—pink for setosa, lavender for versicolor, and peachpuff for virginica—using a `switch` statement as the fill encoder. The SVG chart is generated with d3’s `select`, `csv`, `scaleLinear`, `extent`, `axisLeft`, and `axisBottom` APIs, with data loaded from a remote CSV and rendered on a full-window canvas. The plot includes custom axis labels for sepal length and petal length, demonstrating local ES6 module imports and D3’s data-join approach.
AI-generated descriptionAn example showing the capabilities of VizHub:
- Loads D3 via UNPKG.
- Demonstrates use of
importfrom"d3". - Demonstrates use of
importfrom local ES6 modules.
MIT Licensed




Comments
Sign in to join the discussion.