🌍 Public
Fork of Projet UX
Aabdeldev504
Last edited Dec 4, 2022
Created on Dec 4, 2022
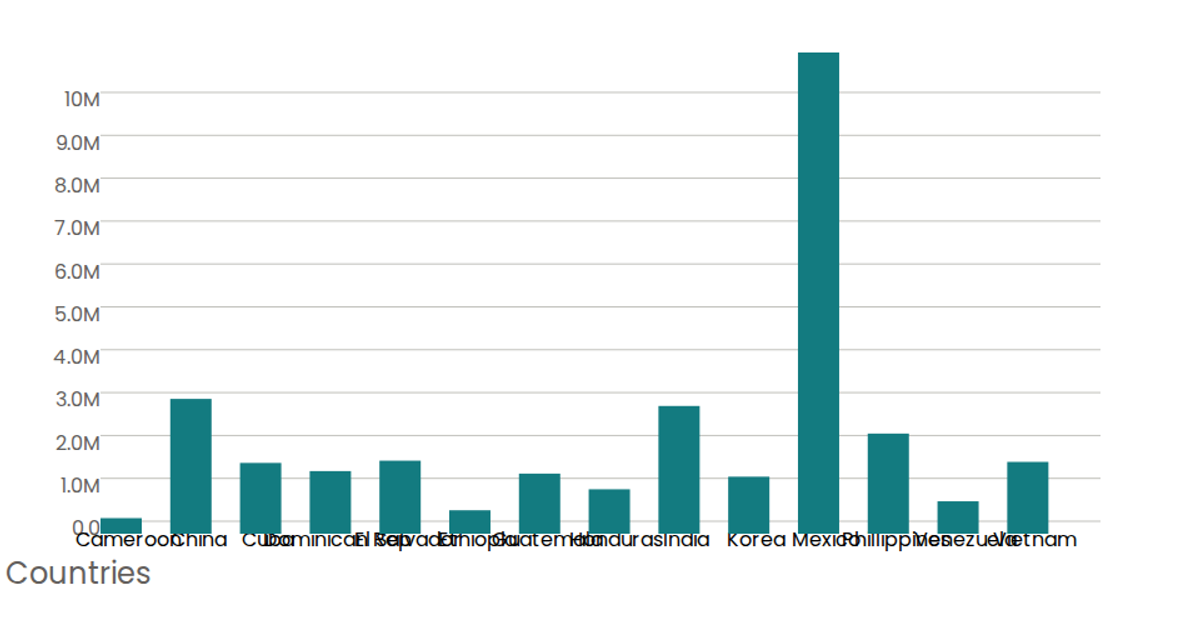
This lollipop chart displays the top ten most popular artists for a selected country, ranked by a numerical count, with circles marking each artist's value. The visualization is built using D3 v5, reading artist data from a JSON file and rendering SVG elements. The chart uses `scaleBand` for the categorical x-axis and `scaleLinear` for the y-axis, with axes drawn via `axisBottom` and `axisLeft`. The data updates dynamically by country, as initiated with the 'FR' code.
AI-generated descriptionMIT Licensed




Comments
Sign in to join the discussion.