🌍 Public
Fork of ICE5
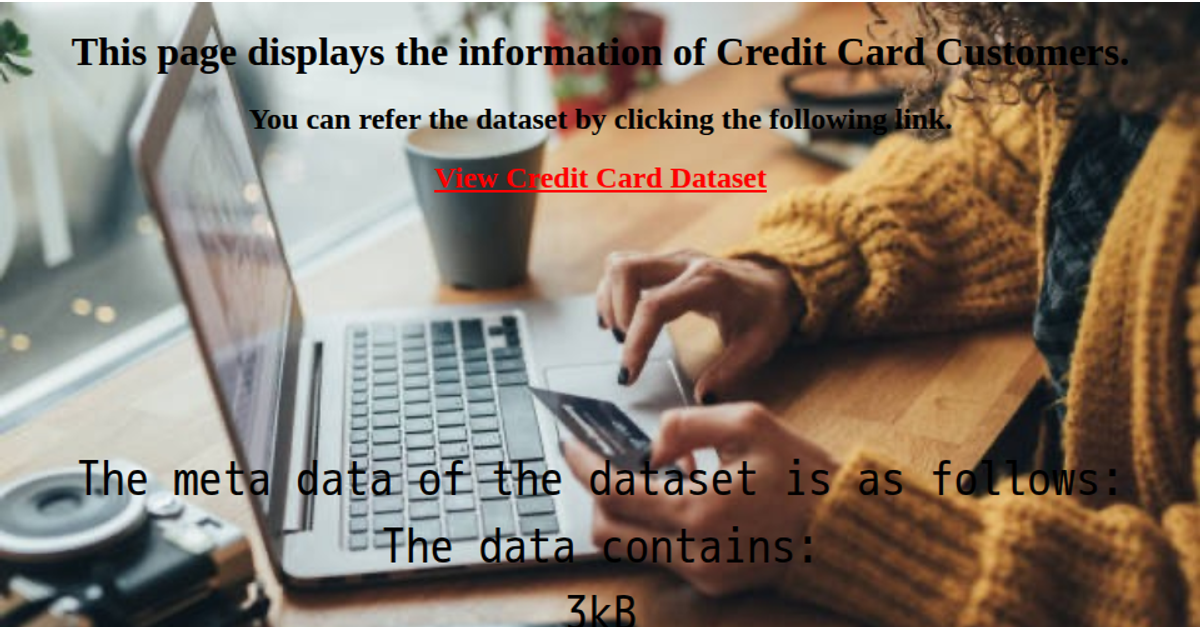
This example displays metadata about a home loan approval dataset, including its file size, row count, and column count, on a yellow page with a centered background image. The code loads the dataset from a CSV file hosted on GitHub using `d3.csv`, then computes the metadata with `d3.csvFormat` and `data.columns.length`. It presents the results in an HTML `<pre>` element. Styling is handled via CSS, while D3 v7 and plain JavaScript manage the data fetching and display.
AI-generated descriptionA bare minimum HTML page demonstrating use of CSS and JavaScript.
See also React Starter.
MIT Licensed




Comments
Sign in to join the discussion.