🌍 Public
Line Chart - Variant
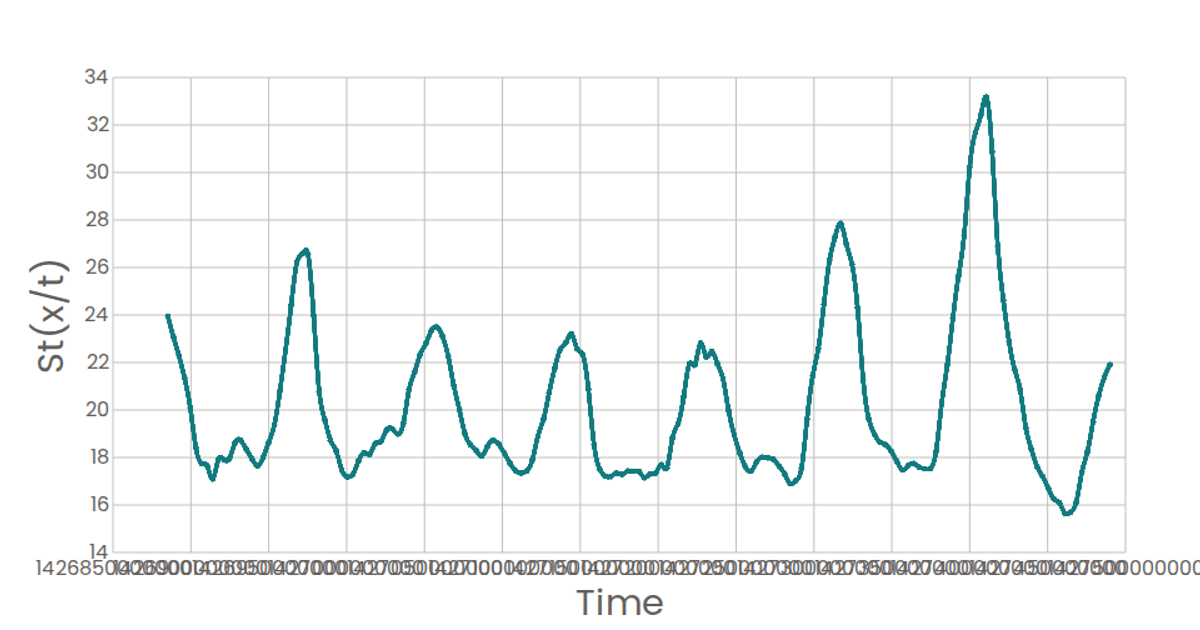
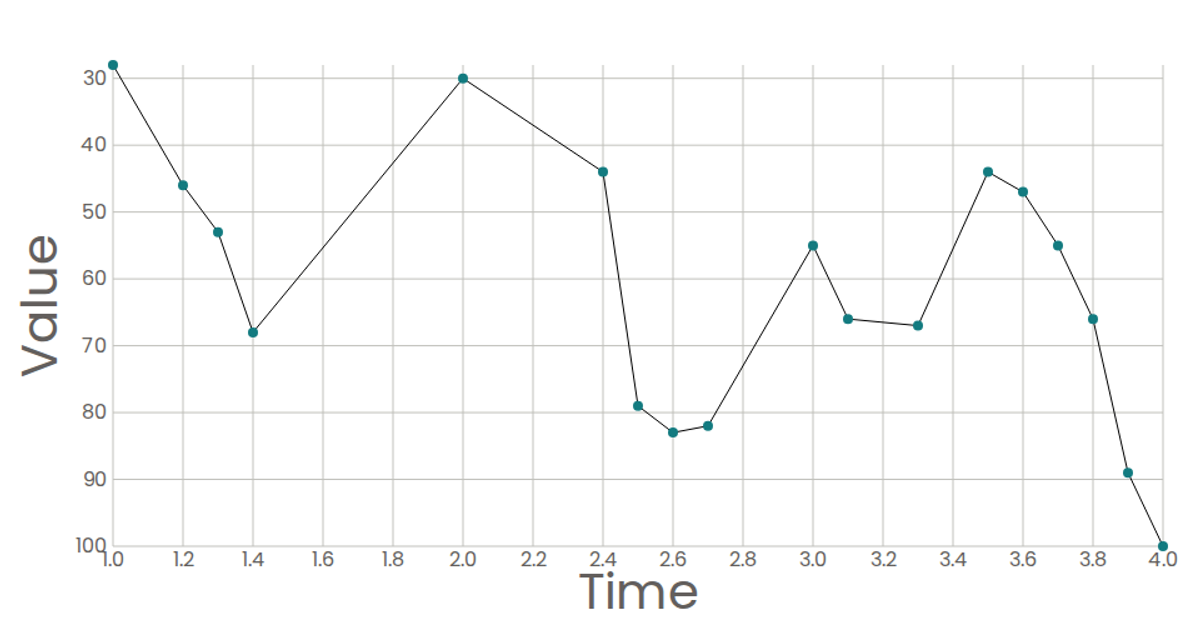
This line chart visualizes the decay of a genetic variant's frequency over time, with time in days on the x-axis and S(t/x) on the y-axis. The chart renders a single polyline with circular markers, using D3 scales (scaleLinear) and the line() generator with curveLinear in a React SVG component. The data comes from a hardcoded variant object containing genomic information, while the visual styling uses Poppins font and teal-colored strokes. Axis components are custom-built with D3 tick generation.
AI-generated descriptionWorking with Time Data: Temperature in your City.
MIT Licensed




Comments
Sign in to join the discussion.