🌍 Public
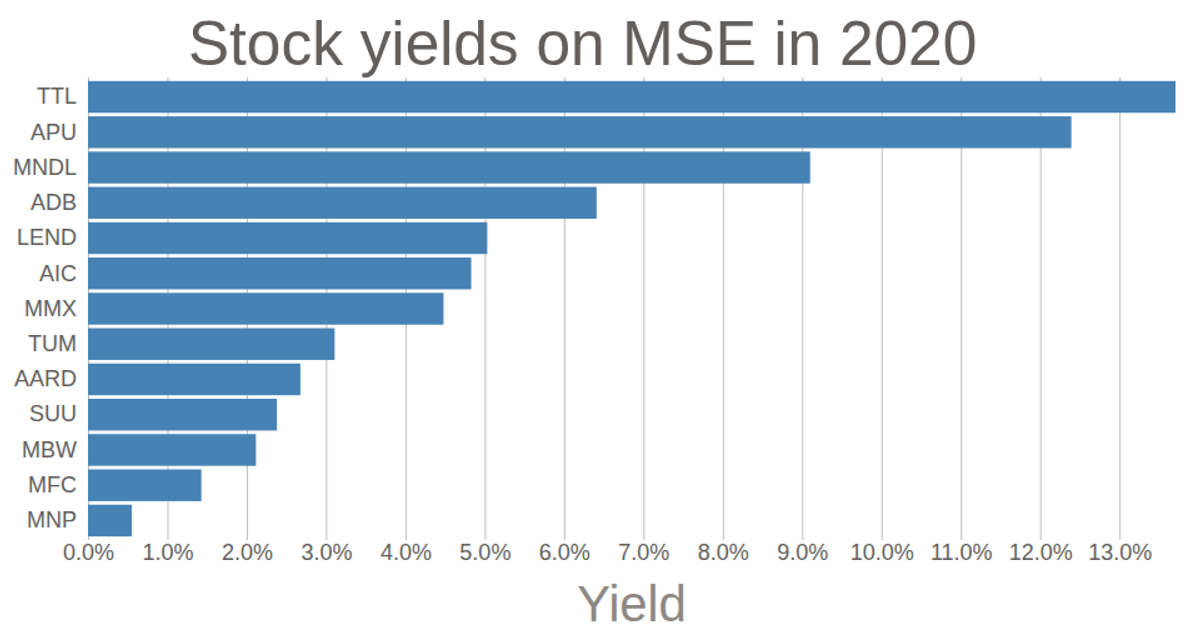
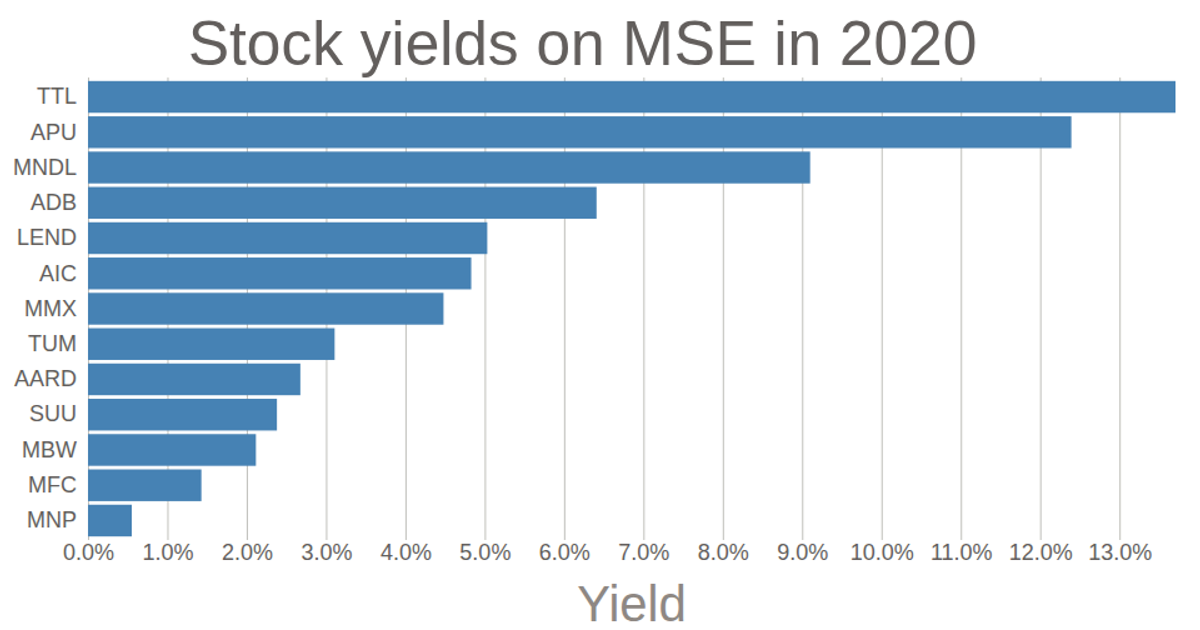
Scatterplot of Stock yields
A scatterplot displays stock yields for 13 companies on the MSE in 2020, calculating each yield as dividend divided by book value and sorting companies in descending order. Circles are positioned using d3.scaleLinear for the x-axis and d3.scalePoint for the categorical y-axis, with axes rendered via d3.axisBottom and d3.axisLeft. The code loads data from a CSV file with d3.csv and uses SVG rendering with d3.v6.
AI-generated descriptionMIT Licensed



Comments
Sign in to join the discussion.