🌍 Public
Adjacency matrix in D3
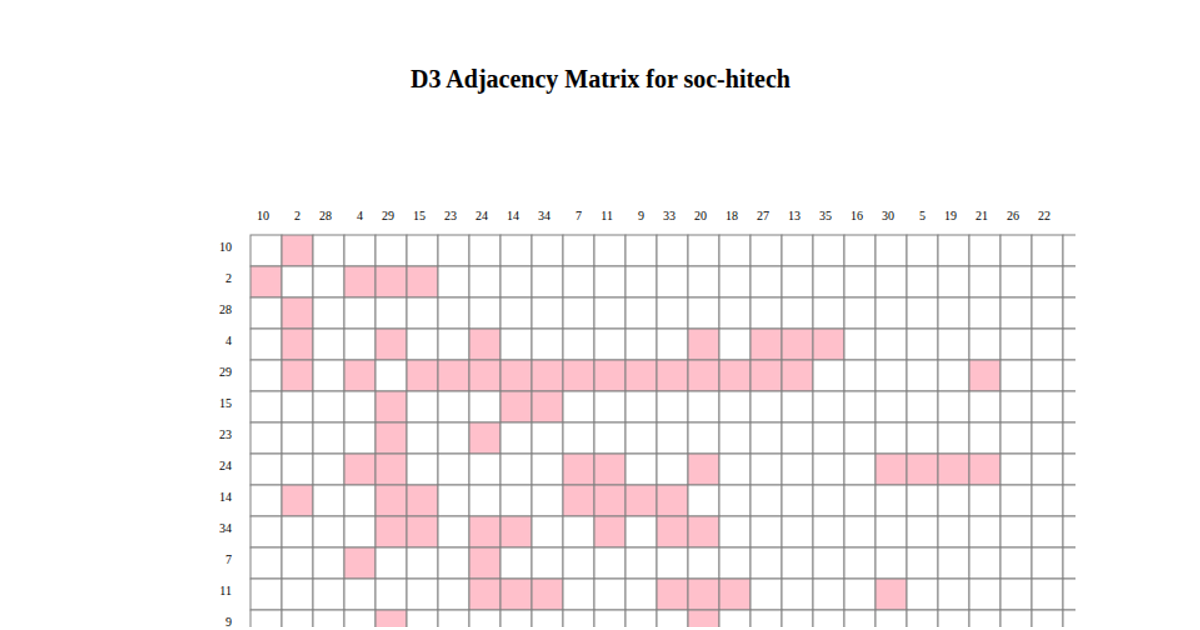
This example uses D3 v7 to render an adjacency matrix for the FIRM-HI-TECH dataset from networkrepository.com. It shows the relationships between firms as a grid of lightblue cells, where each row and column represents a node. The code loads CSV data with `d3.csv`, builds a matrix using a JavaScript `Map` and `Set`, and applies `d3.scaleBand` for the axes. Hovering highlights the row and column via stroke-width changes and displays a tooltip with the matrix cell’s link. The SVG is drawn with appended `rect` elements, and the interface includes numbered axis labels.
AI-generated descriptionNode-link diagram with force-directed layout of FIRM-HI-TECH Dataset.
Reference to Interactive Data Visualization for the Web
MIT Licensed




Comments
Sign in to join the discussion.