Multiview for Cities Ranked by Number of skyscraper Completed Structures with improve performance optimaization
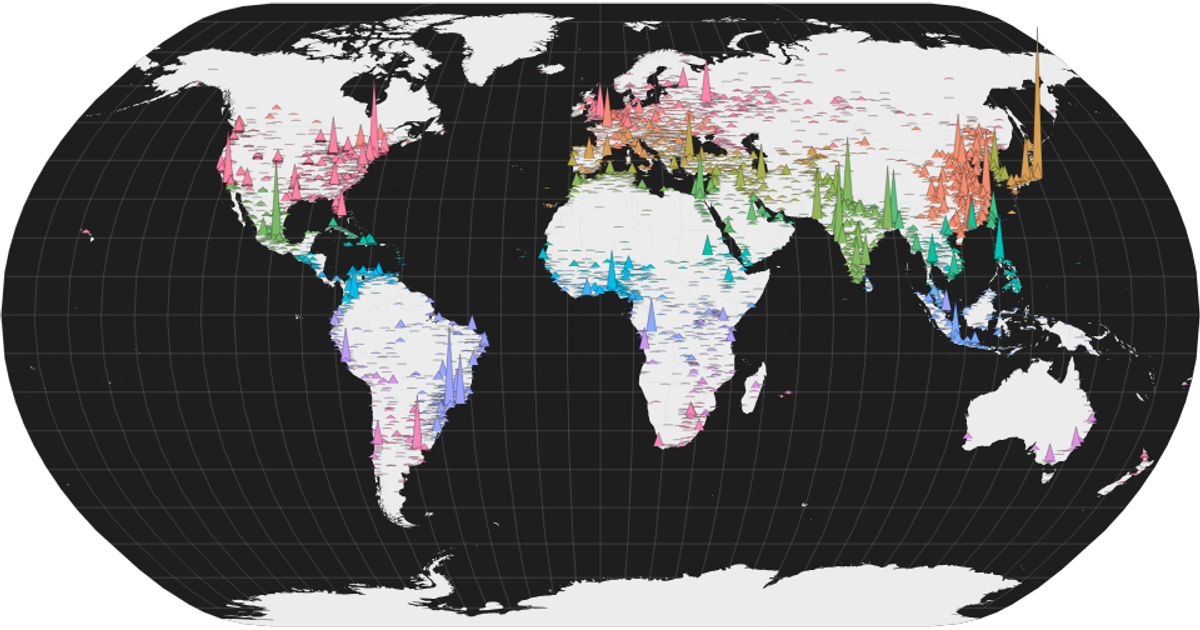
This interactive visualization combines a world map with a time-series histogram to explore skyscraper construction across cities. The map displays each city as a triangular mountain, with height encoding the total number of completed structures over 100 meters, while color distinguishes countries. A brushable histogram below filters cities by the date of their first building over 150 meters. Built with React and D3 v5, the visualization uses `geoNaturalEarth1` and `geoPath` for the map, `scaleLinear` for heights, and `brushX` for interactive filtering. Data comes from a CSV of city building counts with coordinates added manually.
AI-generated descriptionA world map showing the number of completed highest structures in cities. The building should be greater than 100 meters high to be counted.
- Height represents the number of buildings.
- Color represents the city.
City-data from Cities Ranked by Number of Completed Structures.
Country boundaries from World Atlas TopoJSON, polished for visual style, including graticules.
I add Latitude and Longitude by using Latitude and Longitude Finder note: I am still working on latitude and longitude for every city. (last update 28 Oct 2020)
Colors inspired by UNHCR Streamgraph Explorer.




Comments
Sign in to join the discussion.