🌍 Public
ICE-8 Sushmitha B 2A Tree
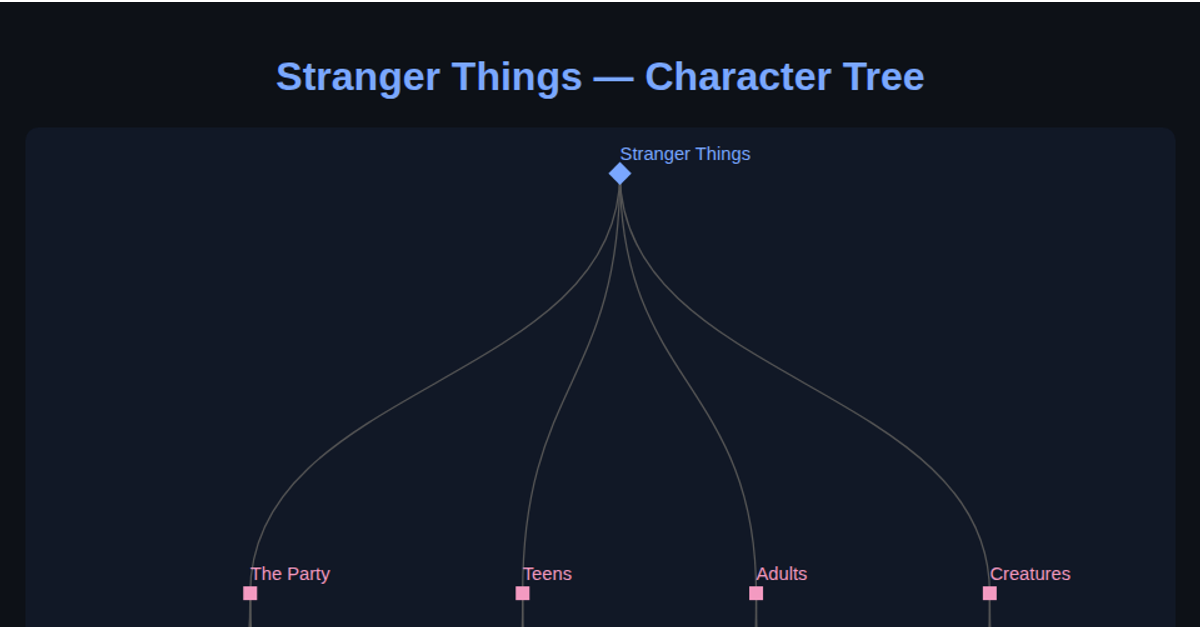
This interactive tree diagram visualizes the hierarchy of Netflix’s top four original shows organized by country. Root, country, show, and character nodes are represented with distinct geometric shapes and colors. The visualization uses the D3.js v7 library, loading CSV data from a GitHub gist. It employs the `d3.stratify`, `d3.tree`, and `d3.linkVertical` APIs to compute and render the layered layout as an SVG, with node styling and labels applied via D3’s selection and join methods.
AI-generated descriptionMIT Licensed




Comments
Sign in to join the discussion.