🌍 Public
VarshaGAustraliaMap
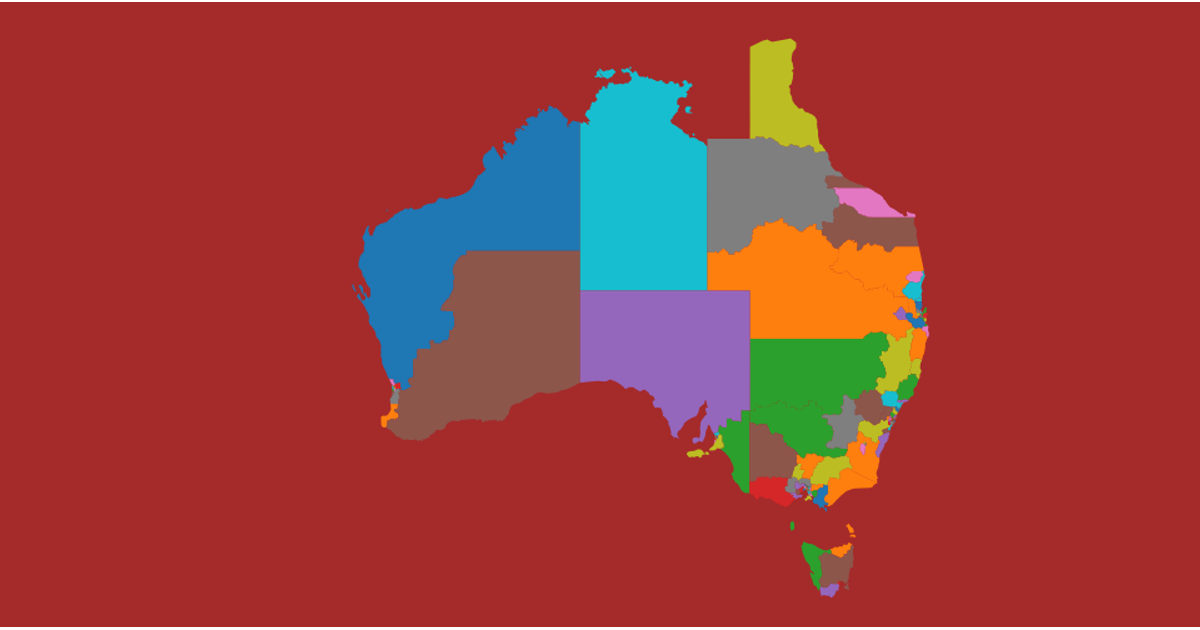
This visualization displays the electoral regions of Australia, colored with a categorical palette and labeled with their names. It uses the `topojson` library to convert data from `australia.json` into geographic features, which are then rendered as SVG paths using `d3.geoPath` with a `d3.geoMercator` projection. State boundaries are highlighted with a black stroke, and each region's name is positioned at its centroid.
AI-generated descriptionA bare minimum HTML page demonstrating use of CSS and JavaScript.
See also React Starter.
MIT Licensed




Comments
Sign in to join the discussion.