🌍 Public
Task9 Questin 1
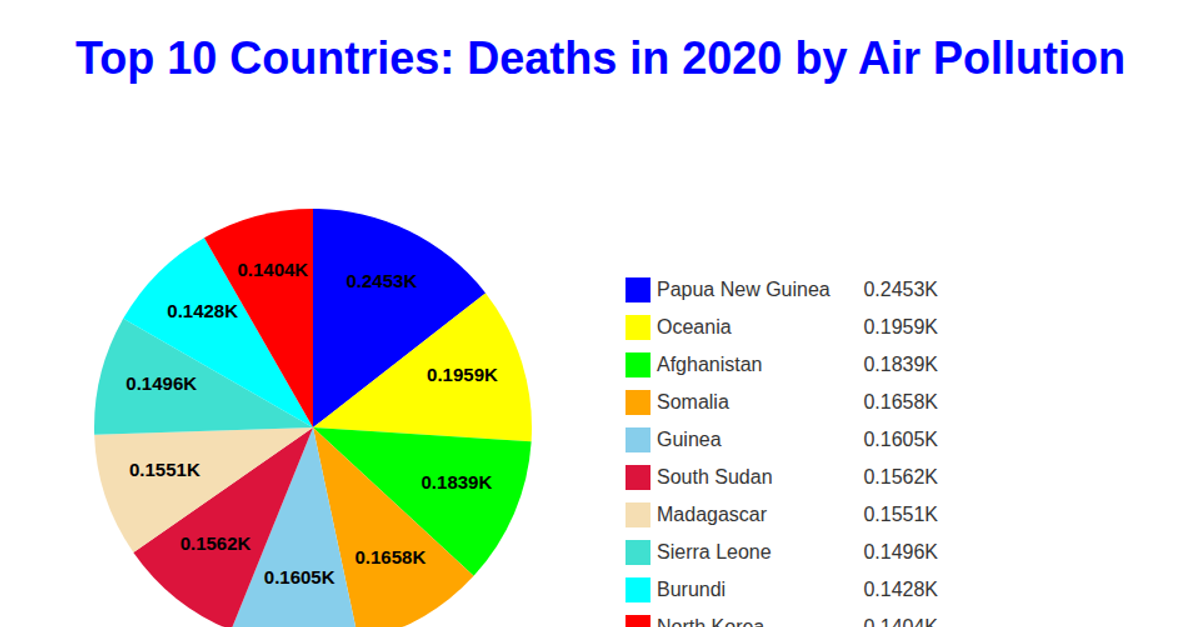
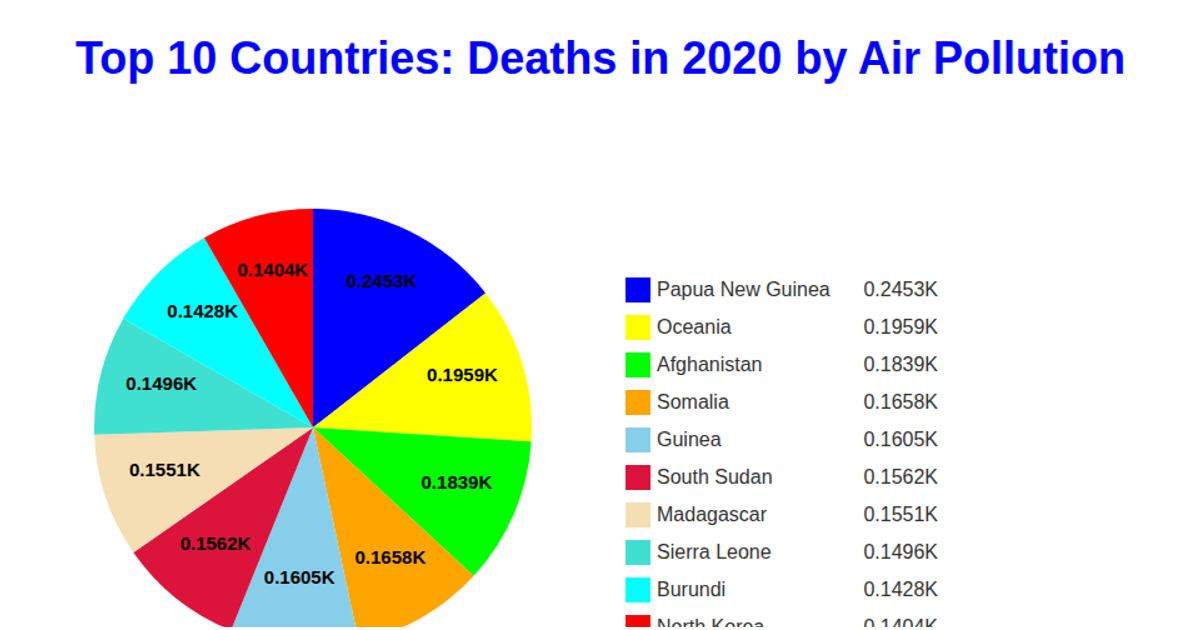
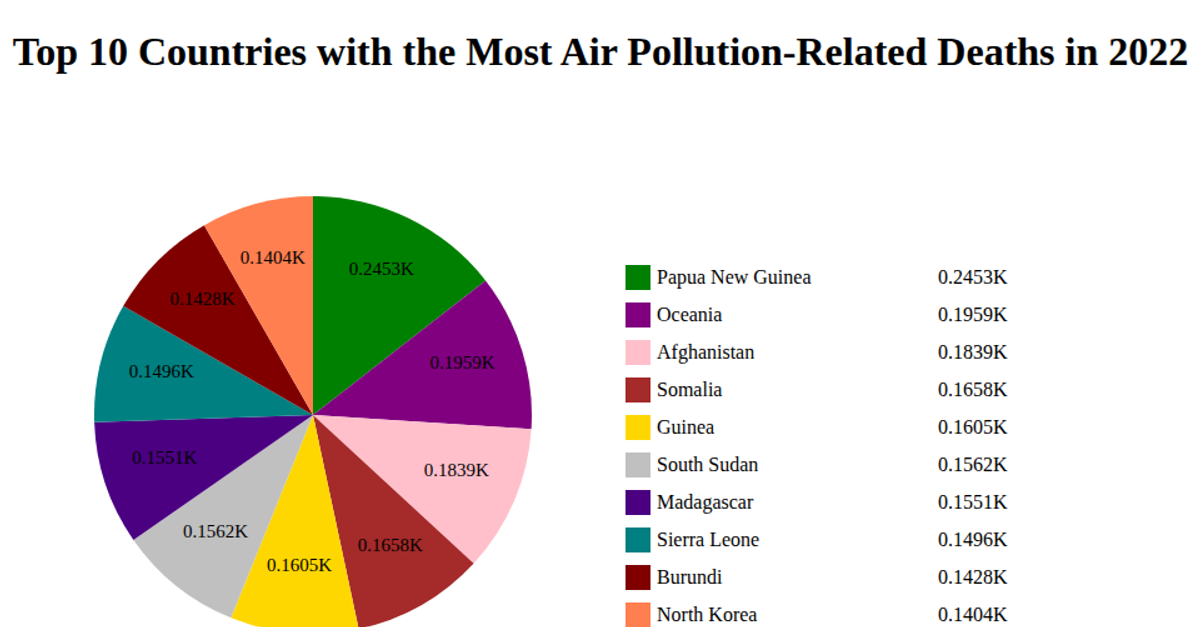
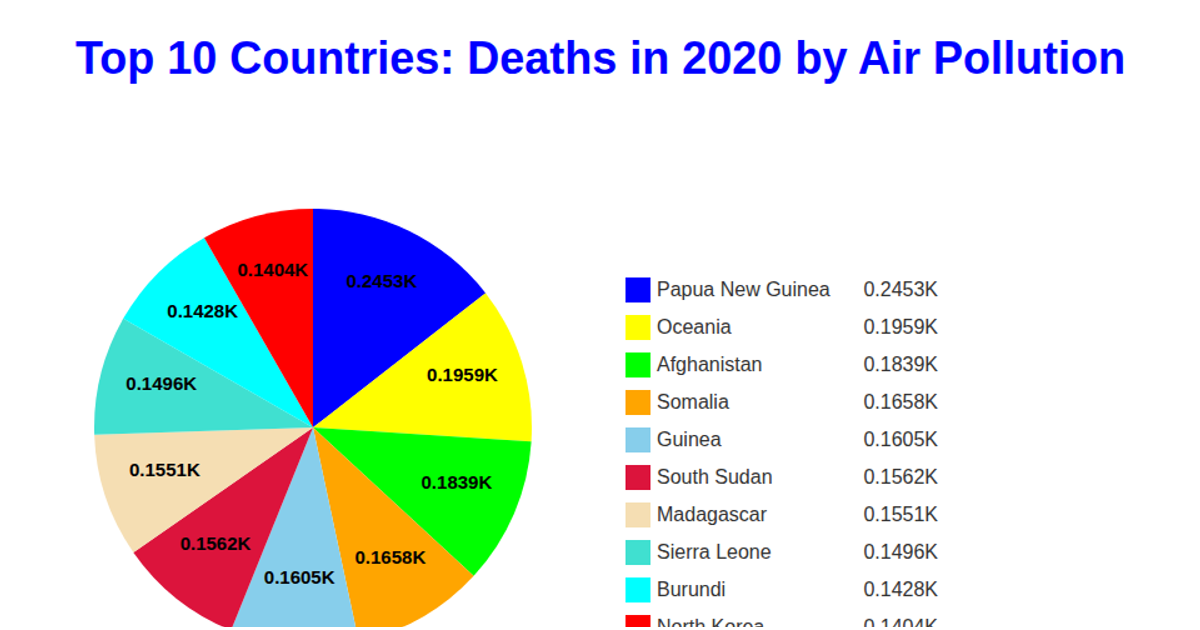
This pie chart shows the top 10 countries by deaths from air pollution in 2020, with each slice labeled with the death count in thousands and a corresponding legend. The visualization uses D3 v5’s `pie` and `arc` generators to create the chart, `scaleOrdinal` for slice colors, and `csv` to load data from a GitHub repository. Slices and legend items are rendered as SVG elements, with text labels positioned using `arcGenerator.centroid`, and the legend displays country names alongside their death totals.
AI-generated descriptionA bare minimum HTML page.
MIT Licensed



Comments
Sign in to join the discussion.