🌍 Public
Scatter Plots Of Iris
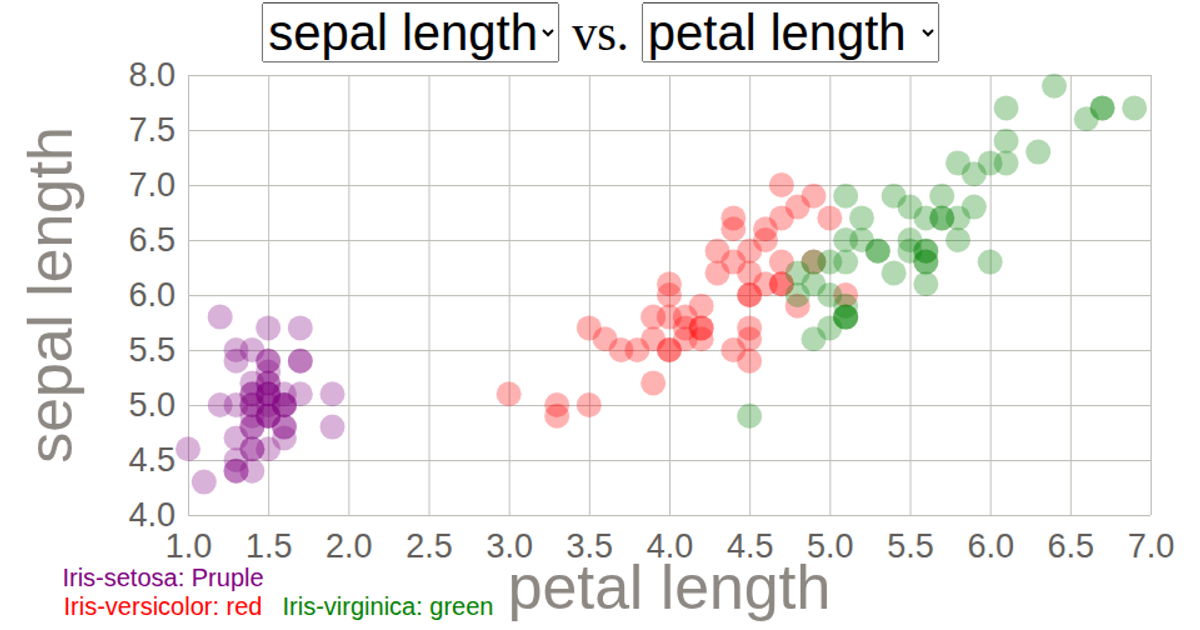
Interactive scatter plots show the relationships between pairs of measurements from the classic Iris flower dataset, with dropdown menus to select which features appear on the x- and y-axes. D3 v5 scales map sepal and petal measurements to SVG circle positions, while a categorical color scale distinguishes the three Iris species, which are also listed in a manual legend. Circles animate into place using `transition().duration()` with staggered delays. The example demonstrates reusable ES6 modules for the scatter plot, dropdown menu, and color legend components.
AI-generated descriptionAn example showing the capabilities of VizHub:
- Loads D3 via UNPKG.
- Demonstrates use of
importfrom"d3". - Demonstrates use of
importfrom local ES6 modules.
MIT Licensed




Comments
Sign in to join the discussion.